
Relative Risk vs Odds Ratio
Relative risk (RR) compares the probability of an outcome between two groups, while an odds ratio (OR) compares the odds of that outcome between the groups.They may be calculated from the same data but produce different…
Relative Risk vs Odds Ratio
Relative risk (RR) compares the probability of an outcome between two groups, while an odds ratio (OR) compares the odds of that outcome between the groups. They may be calculated from the same data but produce different numbers because probability and odds are different mathematical quantities.
That difference matters when you read a paper, analyze a study, or explain a result. An OR is not an inaccurate version of RR, and RR is not always the better statistic. The key is to identify what your data can estimate, what quantity answers the research question, and how the result will be communicated. Cochrane explicitly warns that problems arise when an odds ratio is interpreted as though it were a risk ratio, especially when events are common.
Relative Risk vs Odds Ratio: What Is the Difference?
Relative risk answers a probability question: How much more or less likely is the outcome in one group than in another? Odds ratio answers an odds question: How do the event-to-non-event odds in one group compare with those in another?
| Feature | Relative risk (RR) | Odds ratio (OR) |
|---|---|---|
| Compares | Probabilities or risks | Odds |
| Basic form | Risk in group A / risk in group B | Odds in group A / odds in group B |
| Null value | 1 | 1 |
| Typical wording | "Twice the risk" | "Twice the odds" |
| Common contexts | Randomized trials and cohort studies | Case-control analyses and logistic regression |
| Range | 0 to infinity | 0 to infinity |
| Can the ratio be negative? | No | No |
Both RR and OR are ratio measures. A value of 1 represents no relative difference between the compared groups. Values above or below 1 indicate the direction of the association relative to the chosen reference group. The ratios themselves cannot be negative, although their logarithms can be. The Cochrane Handbook describes risk ratio and odds ratio as standard ratio measures for binary outcomes.
What Is Relative Risk (RR) in Simple Terms?
Relative risk, also called the risk ratio, compares the probability of an event in one group with the probability in another. The terms relative risk and risk ratio are commonly used interchangeably, although many methodological sources prefer "risk ratio" because the calculation is literally a ratio of two risks.
Suppose 20 of 100 exposed people experience an outcome, while 10 of 100 unexposed people experience it. The risks are 0.20 and 0.10.
An RR of 2.0 means the observed risk in the exposed group is twice the risk in the comparison group. An RR of 1 means the risks are equal. An RR below 1 means the numerator group has a lower risk. For example, RR = 0.70 corresponds to a 30% relative reduction because 1 - 0.70 = 0.30.
RR is often intuitive, but it still does not tell you the absolute size of an effect. A risk ratio of 0.5 could represent a change from 2% to 1% or from 80% to 40%. The relative reduction is 50% in both cases, but the practical consequences are very different. Cochrane therefore emphasizes that clinical importance cannot be judged from a relative effect without considering baseline risk.
What Is an Odds Ratio (OR) in Simple Terms?
An odds ratio compares odds, not probabilities. Odds place the number of events over the number of non-events. If 20 of 100 people experience an outcome, 80 do not, so the odds are 20/80 = 0.25.
Using the same example of 20 events among 100 exposed people and 10 events among 100 unexposed people, the exposed-group odds are 20/80 = 0.25 and the unexposed-group odds are 10/90 = 0.111.
The same data therefore produce RR = 2.00 and OR = 2.25. An OR of 2.25 means the odds of the outcome are 2.25 times as high in the exposed group. It does not mean the probability is 2.25 times as high.
Risk vs Odds: The Core Concept Behind RR and OR
The underlying distinction is the denominator. Risk uses everyone who could experience the outcome. Odds use the people who did not experience the outcome as the comparison.
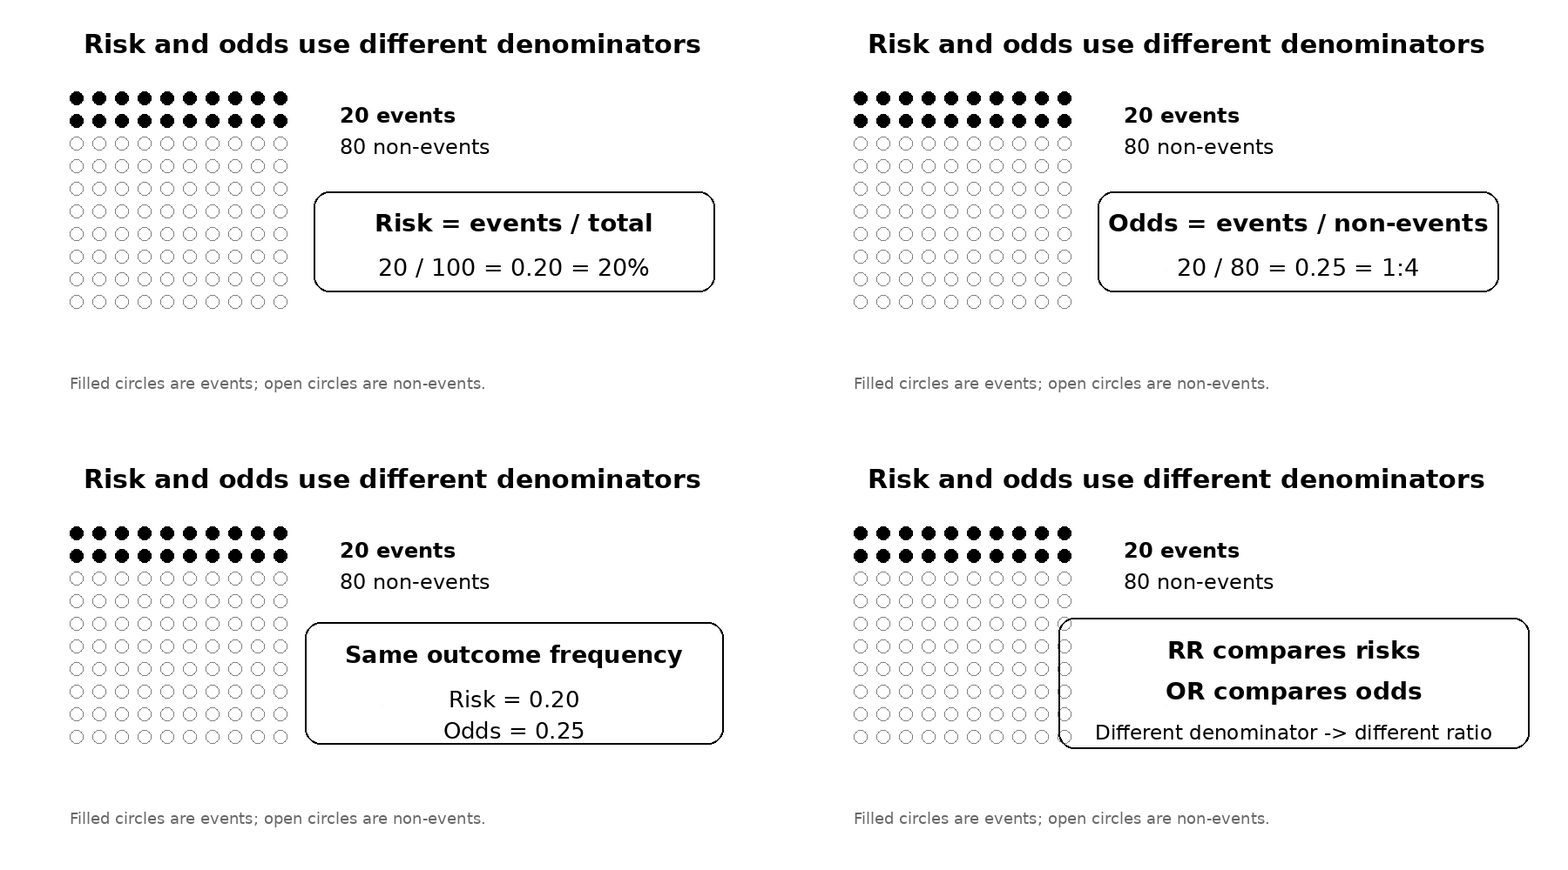
Probability and odds can be converted into one another. If the event probability is p, then odds = p / (1 - p). If odds are known, probability = odds / (1 + odds).
| Probability | Equivalent odds |
|---|---|
| 1% | 0.0101 |
| 5% | 0.0526 |
| 10% | 0.111 |
| 20% | 0.25 |
| 50% | 1.0 |
| 80% | 4.0 |
At very low probabilities, odds and risk are numerically close. As probability increases, they separate. This mathematical relationship is the reason RR and OR are similar for rare outcomes but can diverge sharply for common outcomes.
How to Calculate Relative Risk and Odds Ratio From a 2 x 2 Table
A binary outcome is often summarized in a 2 x 2 table. Let a and b represent events and non-events in the exposed or treatment group, and c and d represent events and non-events in the comparison group.
| Outcome present | Outcome absent | Total | |
|---|---|---|---|
| Exposed or treatment | a | b | a + b |
| Unexposed or control | c | d | c + d |
The risk in the exposed group is a/(a+b), and the risk in the comparison group is c/(c+d).
The odds in the exposed group are a/b, and the odds in the comparison group are c/d.
With a = 20, b = 80, c = 10, and d = 90, RR = 2.00 while OR = 2.25. Calculating both from the same dataset is usually the fastest way to understand why they are not interchangeable.
Why Relative Risk and Odds Ratio Can Give Very Different Numbers
The difference becomes much more visible when the outcome is common. Suppose an outcome occurs in 60% of one group and 30% of another.
The corresponding odds are 0.60/0.40 = 1.5 and 0.30/0.70 = 0.429.
Both calculations are correct. RR says the probability is twice as high. OR says the odds are 3.5 times as high. Saying "3.5 times the risk" would be incorrect.
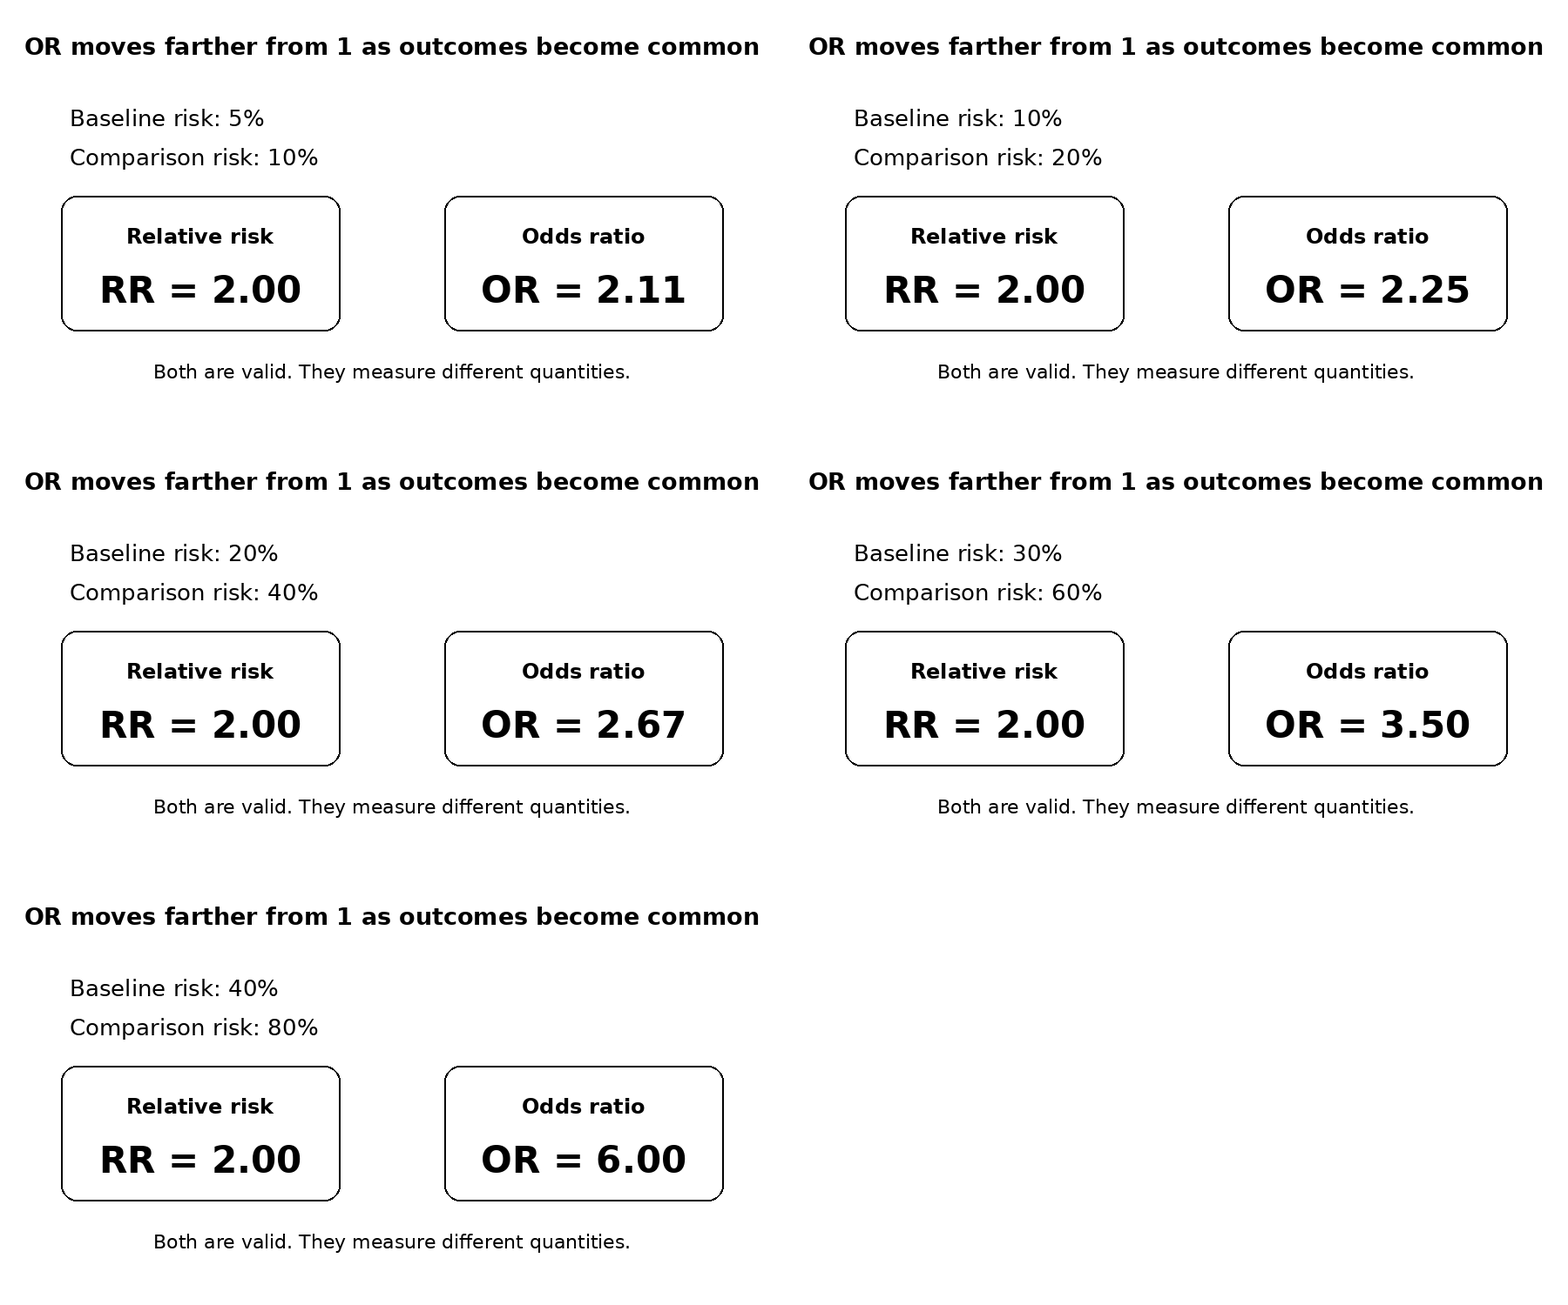
A common shortcut says that OR "overestimates" RR. That wording is incomplete. When the association is above 1, OR is generally farther above 1 than RR. For a protective association below 1, OR is generally farther below 1. Cochrane makes this distinction explicitly.
For example, if risks are 10% versus 30%, RR = 0.33 but OR is about 0.26. The OR is numerically smaller, not larger, yet it is still farther from the null value of 1. The more accurate practical rule is: for common outcomes, OR tends to be more extreme on the ratio scale than RR.
When Should You Use Relative Risk?
RR is most natural when outcome risks can be directly estimated in the groups being compared. This is commonly possible in randomized controlled trials and cohort studies because the denominators at risk are known and participants are followed for the outcome.
A retrospective cohort can also support RR when the source cohort and denominators are known. If the analysis is cross-sectional, the measured quantity may be prevalence rather than incidence risk, so a prevalence ratio can be a more precise label than "relative risk."
RR is often preferable for communication because it maps directly to probability. When the scientific question is "how much does the probability change?" and the design permits direct risk estimation, RR is usually an intuitive answer. For patient or policy decisions, however, it should normally be accompanied by the observed or estimated absolute risks.
When Should You Use an Odds Ratio?
OR is especially important in traditional case-control analyses and logistic regression, but those two contexts need different explanations.
Case-control studies
In a traditional case-control study, investigators deliberately sample people according to outcome status. If they recruit 500 cases and 500 controls, the resulting 50% case proportion is a feature of the sampling plan, not an estimate of population disease risk. That is why risks usually cannot be calculated directly from the sampled case and control totals.
The standard beginner rule that "case-control studies use OR" is useful, but it is not universal. Control-sampling strategy affects the underlying estimand. Methodological work on case-control sampling shows that some designs can target risk ratios or incidence rate ratios rather than a disease odds ratio. A methodological review in the epidemiology literature discusses this distinction. The practical lesson is to understand how controls were sampled before interpreting the reported parameter.
Logistic regression and adjusted odds ratios
Logistic regression models the log odds of a binary outcome. Exponentiating a logistic-regression coefficient therefore gives an odds ratio. This mathematical property, rather than a rule that every binary outcome must be analyzed with OR, explains why adjusted odds ratios are so common.
Researchers can estimate adjusted risk ratios directly in suitable prospective data. For example, Zou's 2004 paper described modified Poisson regression with robust variance for estimating risk ratios. Log-binomial models are another option, although convergence can be a practical issue in some applications.
Advanced readers should also know that odds ratios are noncollapsible. An adjusted OR can differ from an unadjusted OR after conditioning on an outcome-predictive variable even when the variable is not a confounder in the usual causal sense. Whitcomb and Naimi explain why this property complicates comparisons of crude and adjusted odds ratios. A changed OR after adjustment therefore does not, by itself, prove that confounding was present.
When Does the Odds Ratio Approximate Relative Risk?
OR and RR become close when event probabilities are small because odds approach probability as p approaches zero. Mathematically, odds = p/(1-p), and when p is very small, 1-p is close to 1.
You will often see a "10% rule" stating that OR approximates RR when the outcome occurs in fewer than 10% of participants. Treat that as a teaching heuristic, not a mathematical cutoff. The divergence changes continuously rather than suddenly at 10%. Cochrane describes the difference as small for rare events and increasingly important as events become common.
The practical question is not whether a study crosses a magic percentage. It is whether using OR as a stand-in for RR would materially change interpretation for the observed event probabilities and the audience receiving the result.
How to Interpret RR and OR Without Misleading Readers
For both RR and OR, 1 is the null value. Values above 1 indicate a higher risk or higher odds in the numerator group, while values below 1 indicate a lower risk or lower odds. Whether that is beneficial or harmful depends on what the outcome represents and which group is the reference.
If RR = 2, wording such as "the observed risk was twice as high" is appropriate. If OR = 2, the precise wording is "the observed odds were twice as high." Do not automatically translate OR = 2 into "twice as likely."
The second interpretation rule is just as important: a relative measure does not establish the absolute importance of an effect. Consider two scenarios with the same RR of 0.5.
| Scenario | Comparison risk | Treatment/exposed risk | RR | Absolute difference |
|---|---|---|---|---|
| Low baseline risk | 2% | 1% | 0.50 | 1 percentage point |
| High baseline risk | 80% | 40% | 0.50 | 40 percentage points |
The relative effect is identical, but the real-world effect is not. Cochrane emphasizes that the importance of a relative effect depends on the comparator or baseline risk.
Converting an odds ratio to a risk ratio requires baseline risk
If an OR is known and a suitable baseline risk P0 is available, one common conversion is:
This formula shows why OR alone does not determine RR. If OR = 2 and baseline risk is 1%, RR is about 1.98. If baseline risk is 50%, the corresponding RR is about 1.33. Cochrane Chapter 15 likewise requires an assumed comparator risk when translating ORs into risks or risk ratios. Converting adjusted ORs requires additional care because covariate adjustment changes the estimand being summarized.
Relative Risk, Odds Ratio, Risk Difference, and NNT
RR and OR are relative measures. Risk difference (RD) is an absolute measure. If risks are 20% and 10%, the risk difference is 10 percentage points.
| Measure | What it answers |
|---|---|
| Risk difference | How many percentage points separate the groups? |
| Relative risk | How many times as large is one probability as the other? |
| Odds ratio | How many times as large are the event odds? |
For clinical, policy, or individual decisions, an absolute measure is often essential because it describes how many people are actually affected. Cochrane notes that risk difference is particularly useful when considering trade-offs between benefits and harms.
If a treatment reduces risk from 20% to 10%, the absolute risk reduction is 0.10. A simple number needed to treat calculation is therefore 1/0.10 = 10. This means about 10 people would need the intervention rather than the comparator for one additional person to experience the specified benefit over the stated time period. Cochrane Chapter 15 discusses NNT interpretation and stresses the importance of the underlying comparator risk and time horizon.
Confidence Intervals, Statistical Significance, and Zero Cells
A point estimate should be interpreted with its uncertainty. For RR and OR, the null value is 1. If a 95% confidence interval includes 1, the corresponding conventional two-sided significance test does not exclude the null at the 0.05 level. That does not prove there is no effect; it means the data remain compatible with the null and with the range of effects inside the interval. Cochrane recommends interpreting the point estimate and confidence interval together rather than reducing results to a binary significant/not-significant label.
RR and OR are commonly analyzed on the natural-log scale because ratio measures run from 0 to infinity and are asymmetric around 1. On the log scale, RR or OR = 1 becomes 0, while reciprocal effects such as 2 and 0.5 become equally distant from zero in opposite directions. Cochrane Chapter 6 describes this as the standard analytical treatment for ratio measures.
Zero cells create another practical issue. If a required denominator is zero, a conventional RR or OR may be undefined. Adding 0.5 to every cell is a traditional continuity correction, especially in meta-analysis, but it is not automatically harmless. Cochrane Chapter 10 notes that fixed continuity corrections can introduce bias in sparse data, particularly with unequal group sizes. A zero cell should therefore prompt a method check rather than an automatic correction without justification.
Relative Risk vs Odds Ratio: Which One Should You Choose?
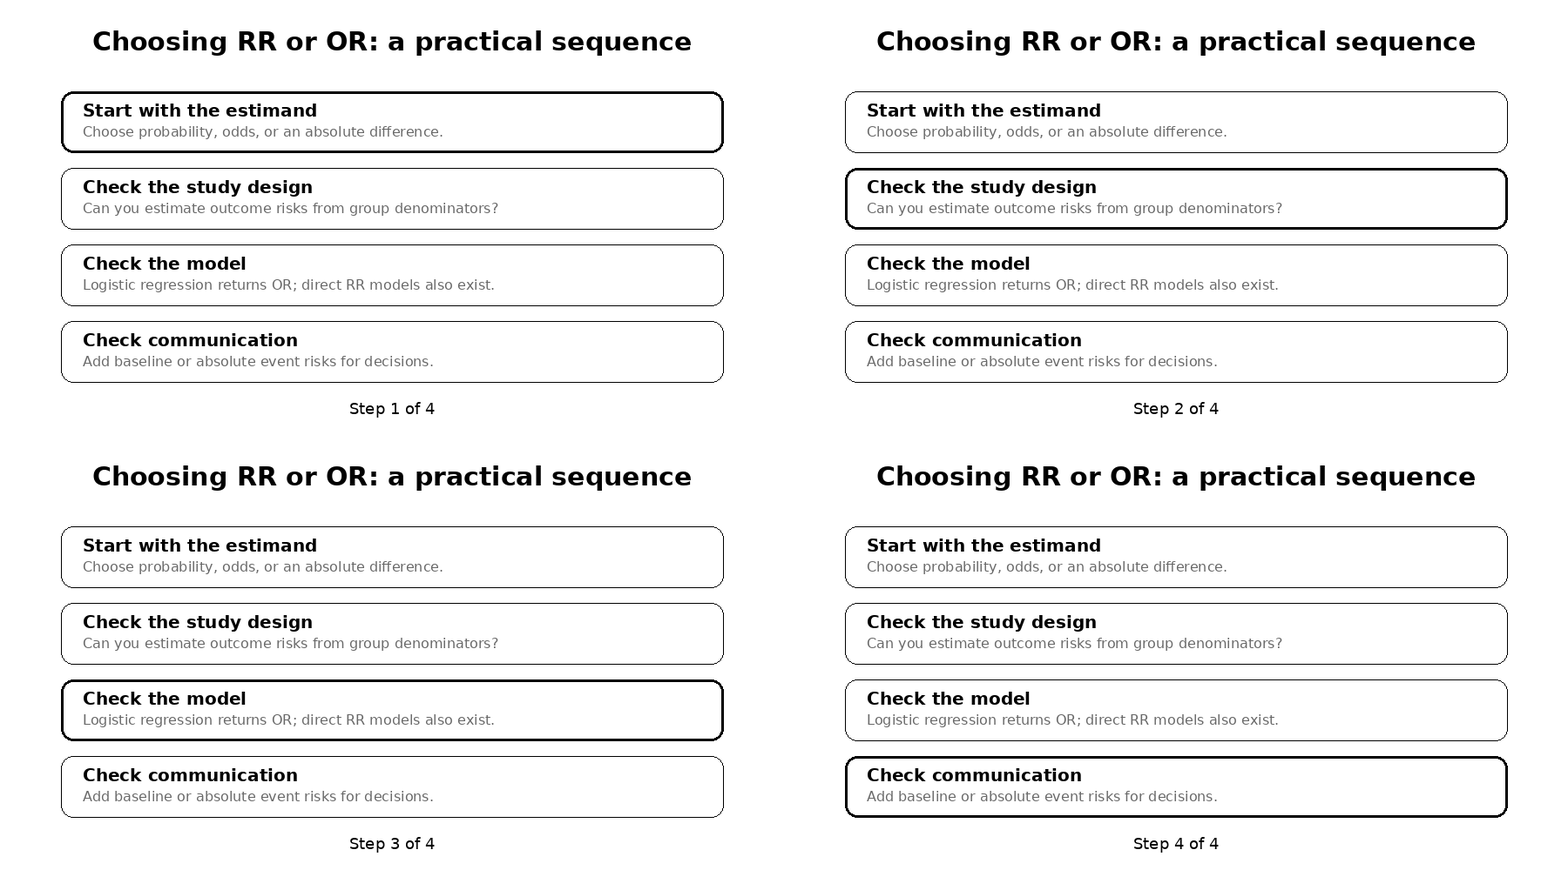
There is no universally superior statistic. Start with the estimand, meaning the quantity your research question is trying to estimate, then check the study design and analytical model.
| Situation | Practical choice |
|---|---|
| Randomized controlled trial | RR is often intuitive; also report absolute event risks or risk difference |
| Prospective cohort study | RR is usually directly estimable |
| Retrospective cohort with known denominators | RR is often directly estimable |
| Traditional cumulative case-control study | OR is commonly appropriate; verify the control-sampling design |
| Logistic regression | OR is the natural exponentiated coefficient |
| Need adjusted risk ratios | Consider a suitable direct RR model such as log-binomial or modified Poisson |
| Communicating treatment effects | RR plus absolute event risks is usually clearer |
| Common outcome | Do not describe OR as though it were RR |
| Rare outcome | OR may be numerically close to RR |
The highest-impact rule is simple: if your question is about probability and risks are directly estimable, RR is often the clearer effect measure. If your design or model estimates odds, OR may be valid, but report and interpret it as odds. When the result will influence a real-world decision, add baseline or absolute event risks.
Common Mistakes When Comparing RR and OR
The most consequential mistake is reporting an OR as though it were a risk ratio. An OR of 3 means three times the odds, not automatically three times the probability.
Another mistake is saying OR is always higher than RR. For effects above 1, OR tends to be farther above 1; for protective effects below 1, it tends to be farther below 1. The problem is extremity relative to the null, not simply being numerically larger.
A third mistake is treating the 10% rare-outcome rule as an exact law. A fourth is ignoring baseline risk and presenting only a dramatic-looking relative effect. A fifth is selecting RR or OR based on which number appears more impressive rather than on the study design, estimand, and analysis.
For regression analyses, do not assume that a difference between crude and adjusted ORs proves confounding. Noncollapsibility can change an OR after conditioning even in the absence of traditional confounding. This is an advanced issue, but it matters when comparing adjusted estimates across models or studies.
Relative Risk vs Odds Ratio FAQs
Is odds ratio the same as relative risk?
No. Relative risk compares probabilities; odds ratio compares event-to-non-event odds. They may be close for rare outcomes but can diverge substantially when outcomes are common.
Why is odds ratio used instead of relative risk?
OR is commonly used when the sampling design does not provide direct population risks, as in many traditional case-control studies, and because logistic regression naturally produces odds ratios.
Can you calculate relative risk in a case-control study?
Usually not by treating the sampled proportion of cases as population risk. However, the exact estimand depends on how controls were sampled, and some case-control designs can target risk or rate ratios. The study design must be examined rather than relying on the label "case-control" alone.
When are odds ratio and relative risk approximately equal?
They are closest when event probabilities are small. There is no universal percentage at which the approximation suddenly becomes valid or invalid.
Is an odds ratio usually higher than relative risk?
Not in every numerical sense. For ratios above 1, OR tends to be farther above 1 than RR; for ratios below 1, OR tends to be farther below 1. "OR is always higher" is therefore incorrect.
What does an odds ratio of 2 mean?
It means the odds of the event in one group are twice the odds in the reference group. It does not necessarily mean the event probability is twice as high.
What does a relative risk of 2 mean?
It means the observed probability of the event in one group is twice the observed probability in the reference group over the defined study period.
Can relative risk or odds ratio be negative?
No. RR and OR range from zero upward. Their natural logarithms can be negative when the ratio is below 1.
Should researchers report absolute risk as well as RR or OR?
When the result is meant to guide clinical, policy, or individual decisions, reporting absolute event risks or a risk difference is usually highly informative because the same relative effect can represent very different absolute consequences at different baseline risks.
Relative Risk vs Odds Ratio: Key Takeaway
The central decision in relative risk vs odds ratio is not which statistic is more impressive. It is which quantity your study design and research question allow you to estimate correctly. RR compares probabilities and is often easier to communicate when risks are directly measurable. OR compares odds and is indispensable in many case-control analyses and logistic models, but it should not be relabeled as risk.
The most useful next step is to identify your study design, determine whether the group risks are directly estimable, and then report the chosen relative measure together with baseline or absolute event risks when practical importance matters. The statistic is not the interpretation; good interpretation connects the effect measure to the sampling design, baseline risk, uncertainty, and the decision the reader actually needs to make.
Recommended External Sources
| Source | Use in this article |
|---|---|
| Cochrane Handbook, Chapter 6 | Definitions, risk vs odds, RR/OR behavior, risk difference, log scale |
| Cochrane Handbook, Chapter 10 | Effect-measure choice and sparse/zero-event data |
| Cochrane Handbook, Chapter 15 | Baseline risk, absolute effects, NNT, OR-to-risk translation, confidence intervals |
| Zou (2004), American Journal of Epidemiology | Modified Poisson regression for direct adjusted risk-ratio estimation |
| Do Case-Control Studies Always Estimate Odds Ratios? | Why control-sampling strategy changes interpretation of case-control estimates |
| Whitcomb & Naimi on noncollapsibility | Noncollapsibility of odds ratios |