
Migration Between U.S. States: Data, Maps and Trends
See where Americans moved between states using 2024 Census ACS data. Compare state inflows, outflows, interstate balances, top migration routes, and interactive maps.
Migration Between U.S. States: What the Data Shows
See where Americans moved between states using 2024 Census ACS data. Compare state inflows, outflows, interstate balances, top migration routes, and interactive maps.
Migration between U.S. states changes local housing demand, labor supply, school enrollment, consumer markets, and business conditions. The latest Census data show that interstate movement remains common, but the gains and losses are spread very unevenly across the country.
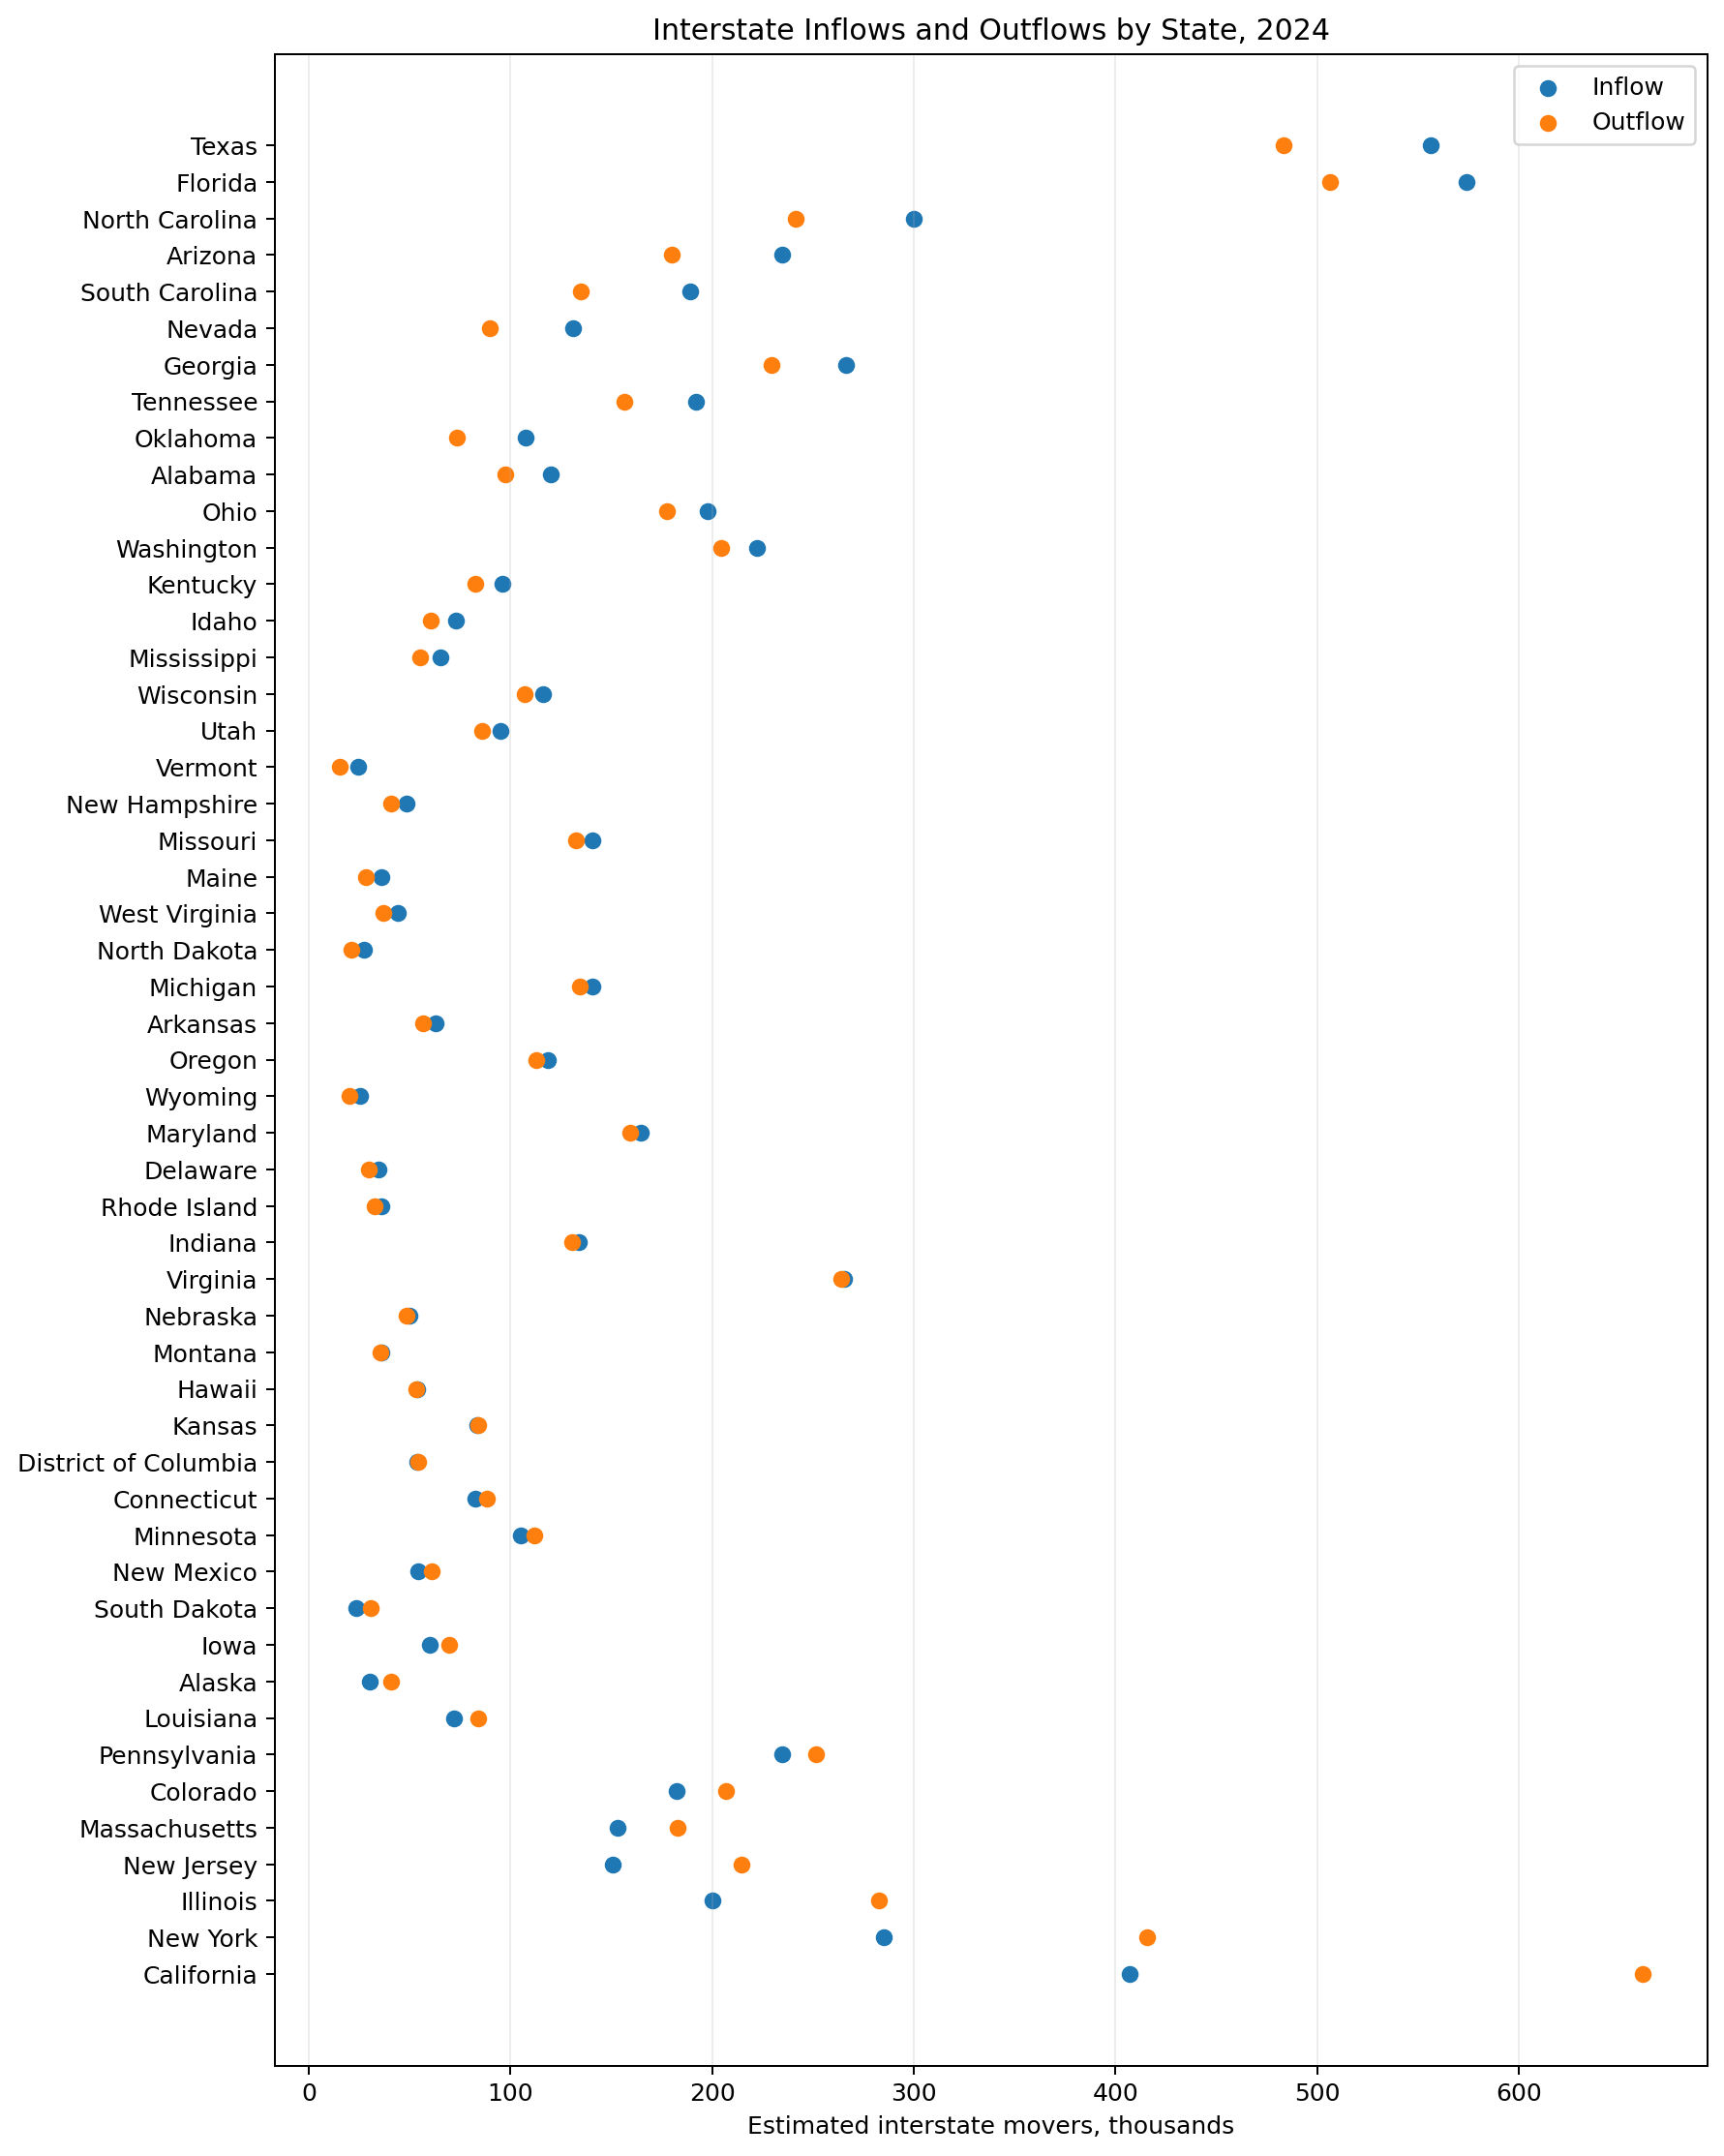
In 2024, 11.8 percent of people age 1 and over lived in a different residence than one year earlier. About 2.1 percent had moved from a different state. The Census state to state flow tables estimate about 7.16 million moves into the 50 states and the District of Columbia from another state.
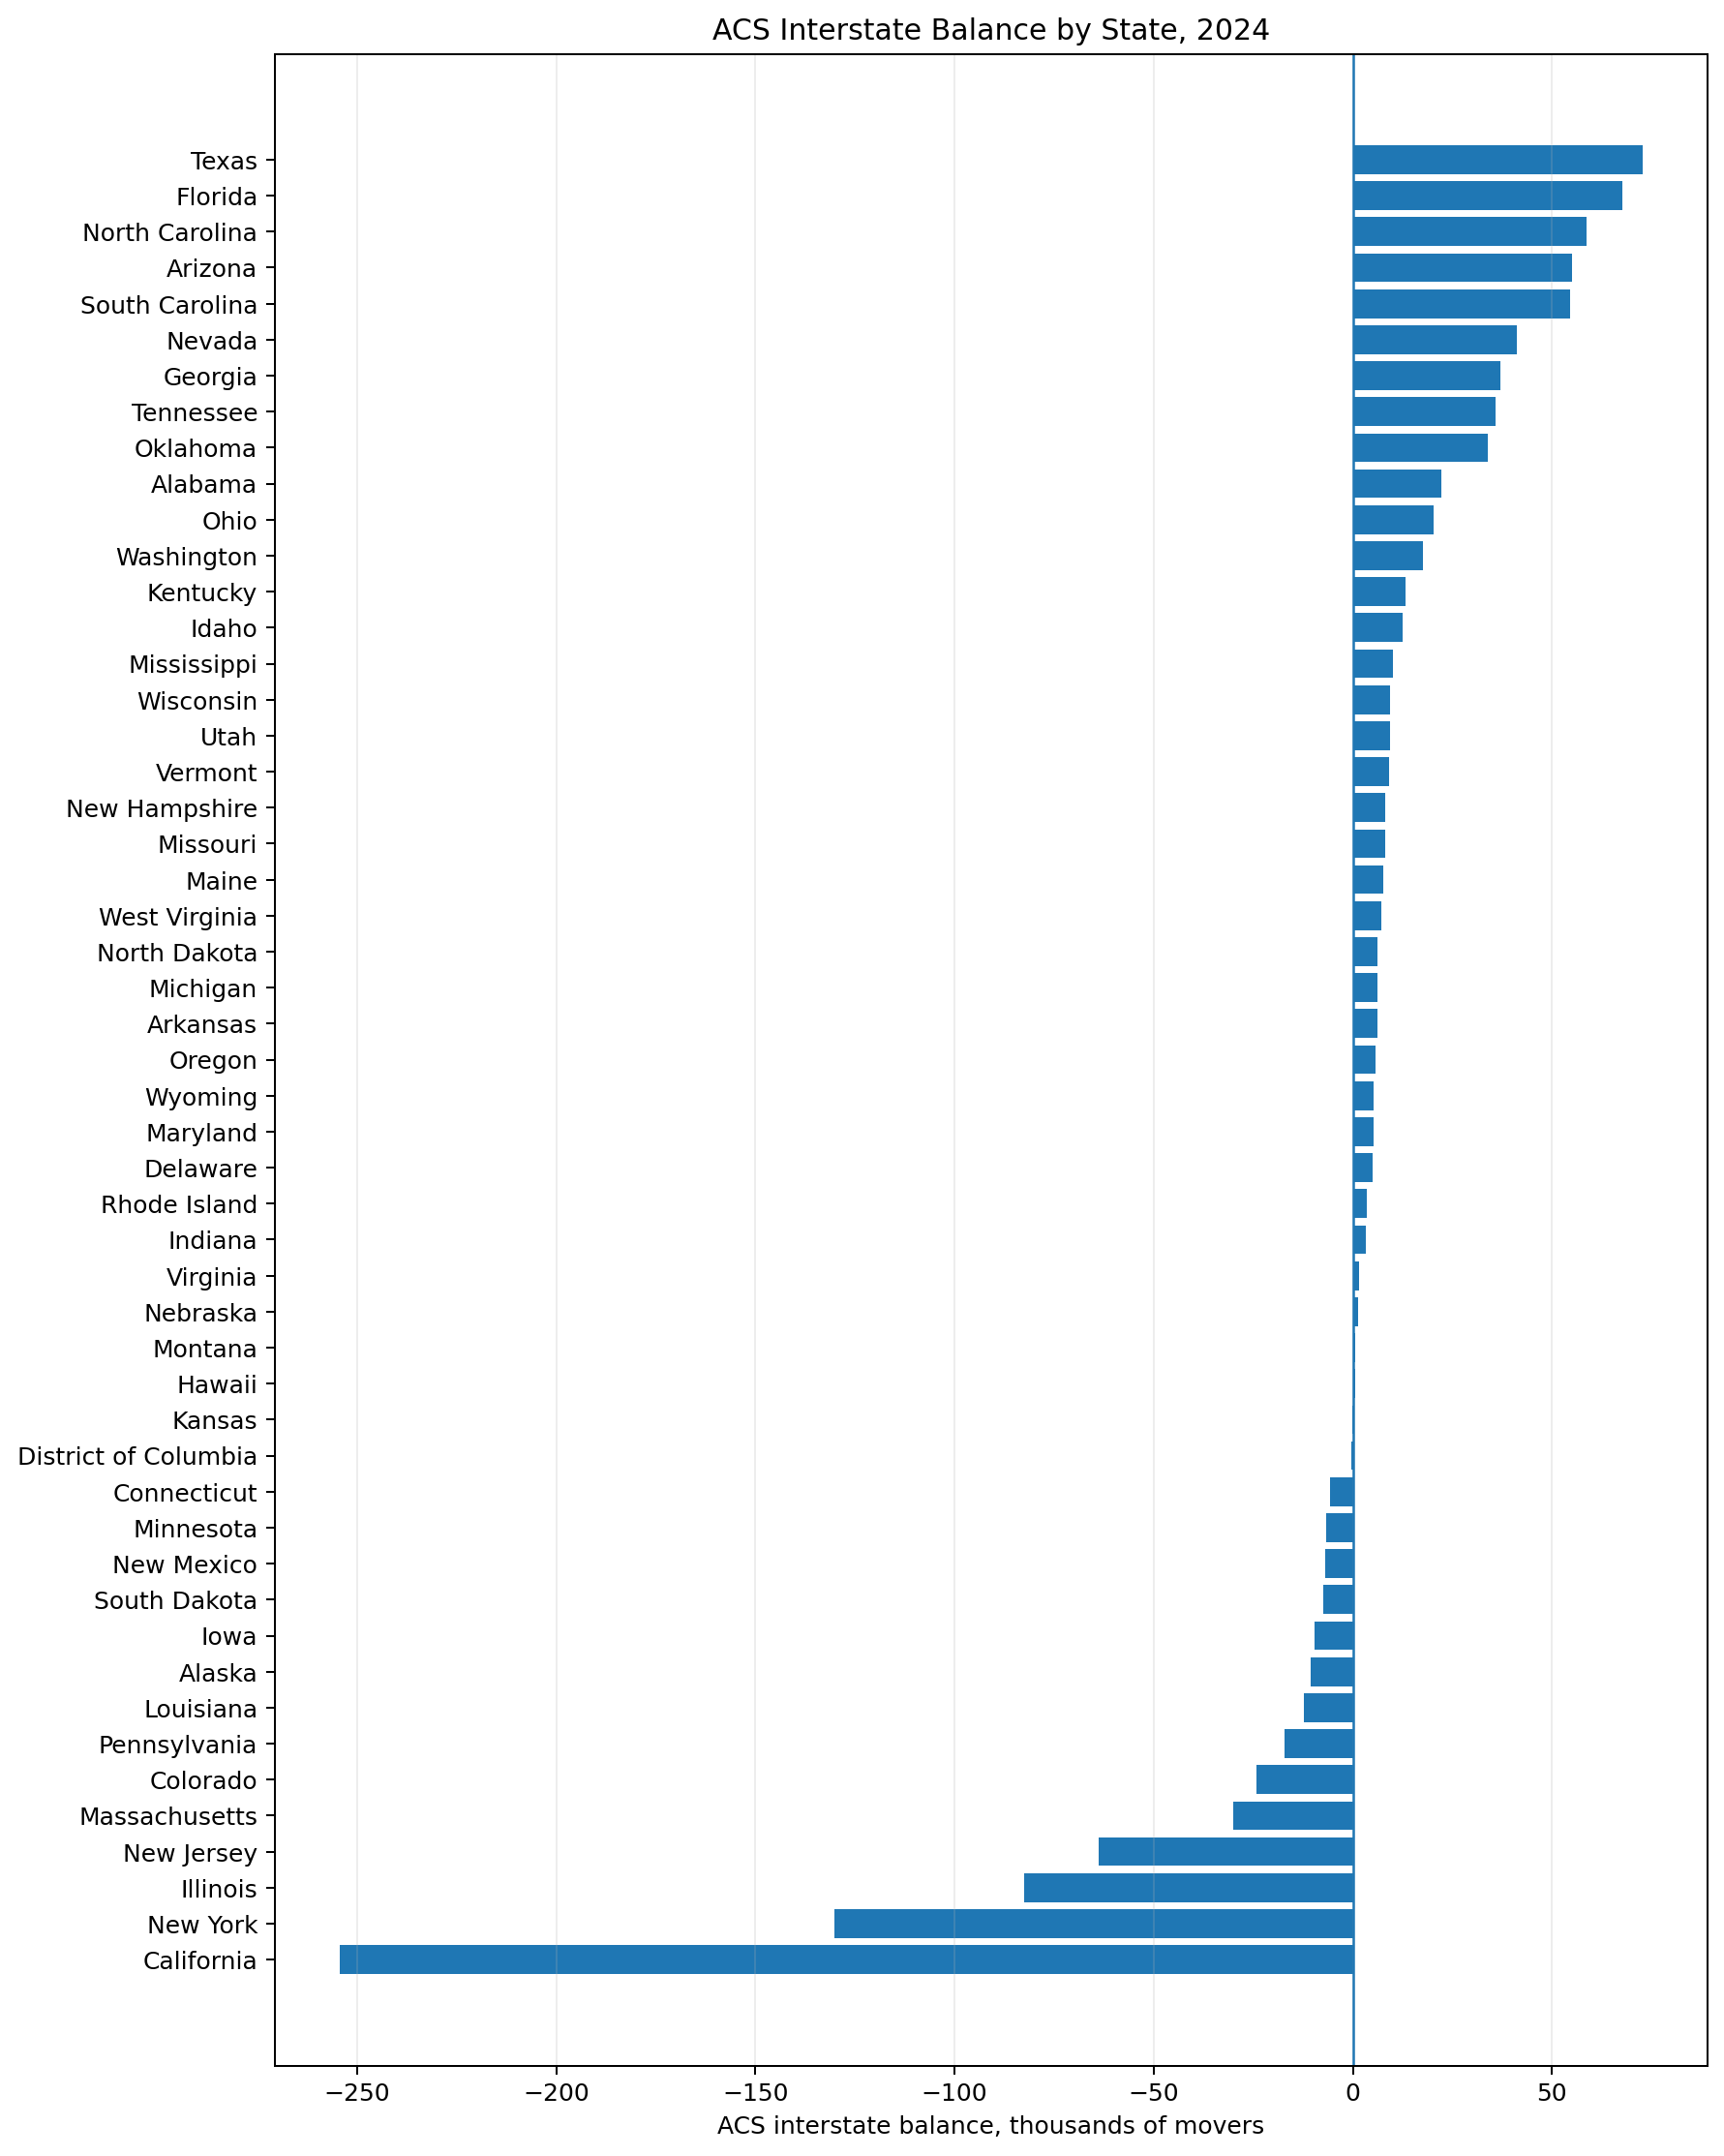
Texas had the largest positive ACS interstate balance at about 72,680 people, followed by Florida at 67,630. California had the largest negative balance at about 254,332, followed by New York at about 130,145. These are survey estimates, so the margins of error matter, especially when two states or routes are close.
Quick Answer
Interactive Interstate Migration Map
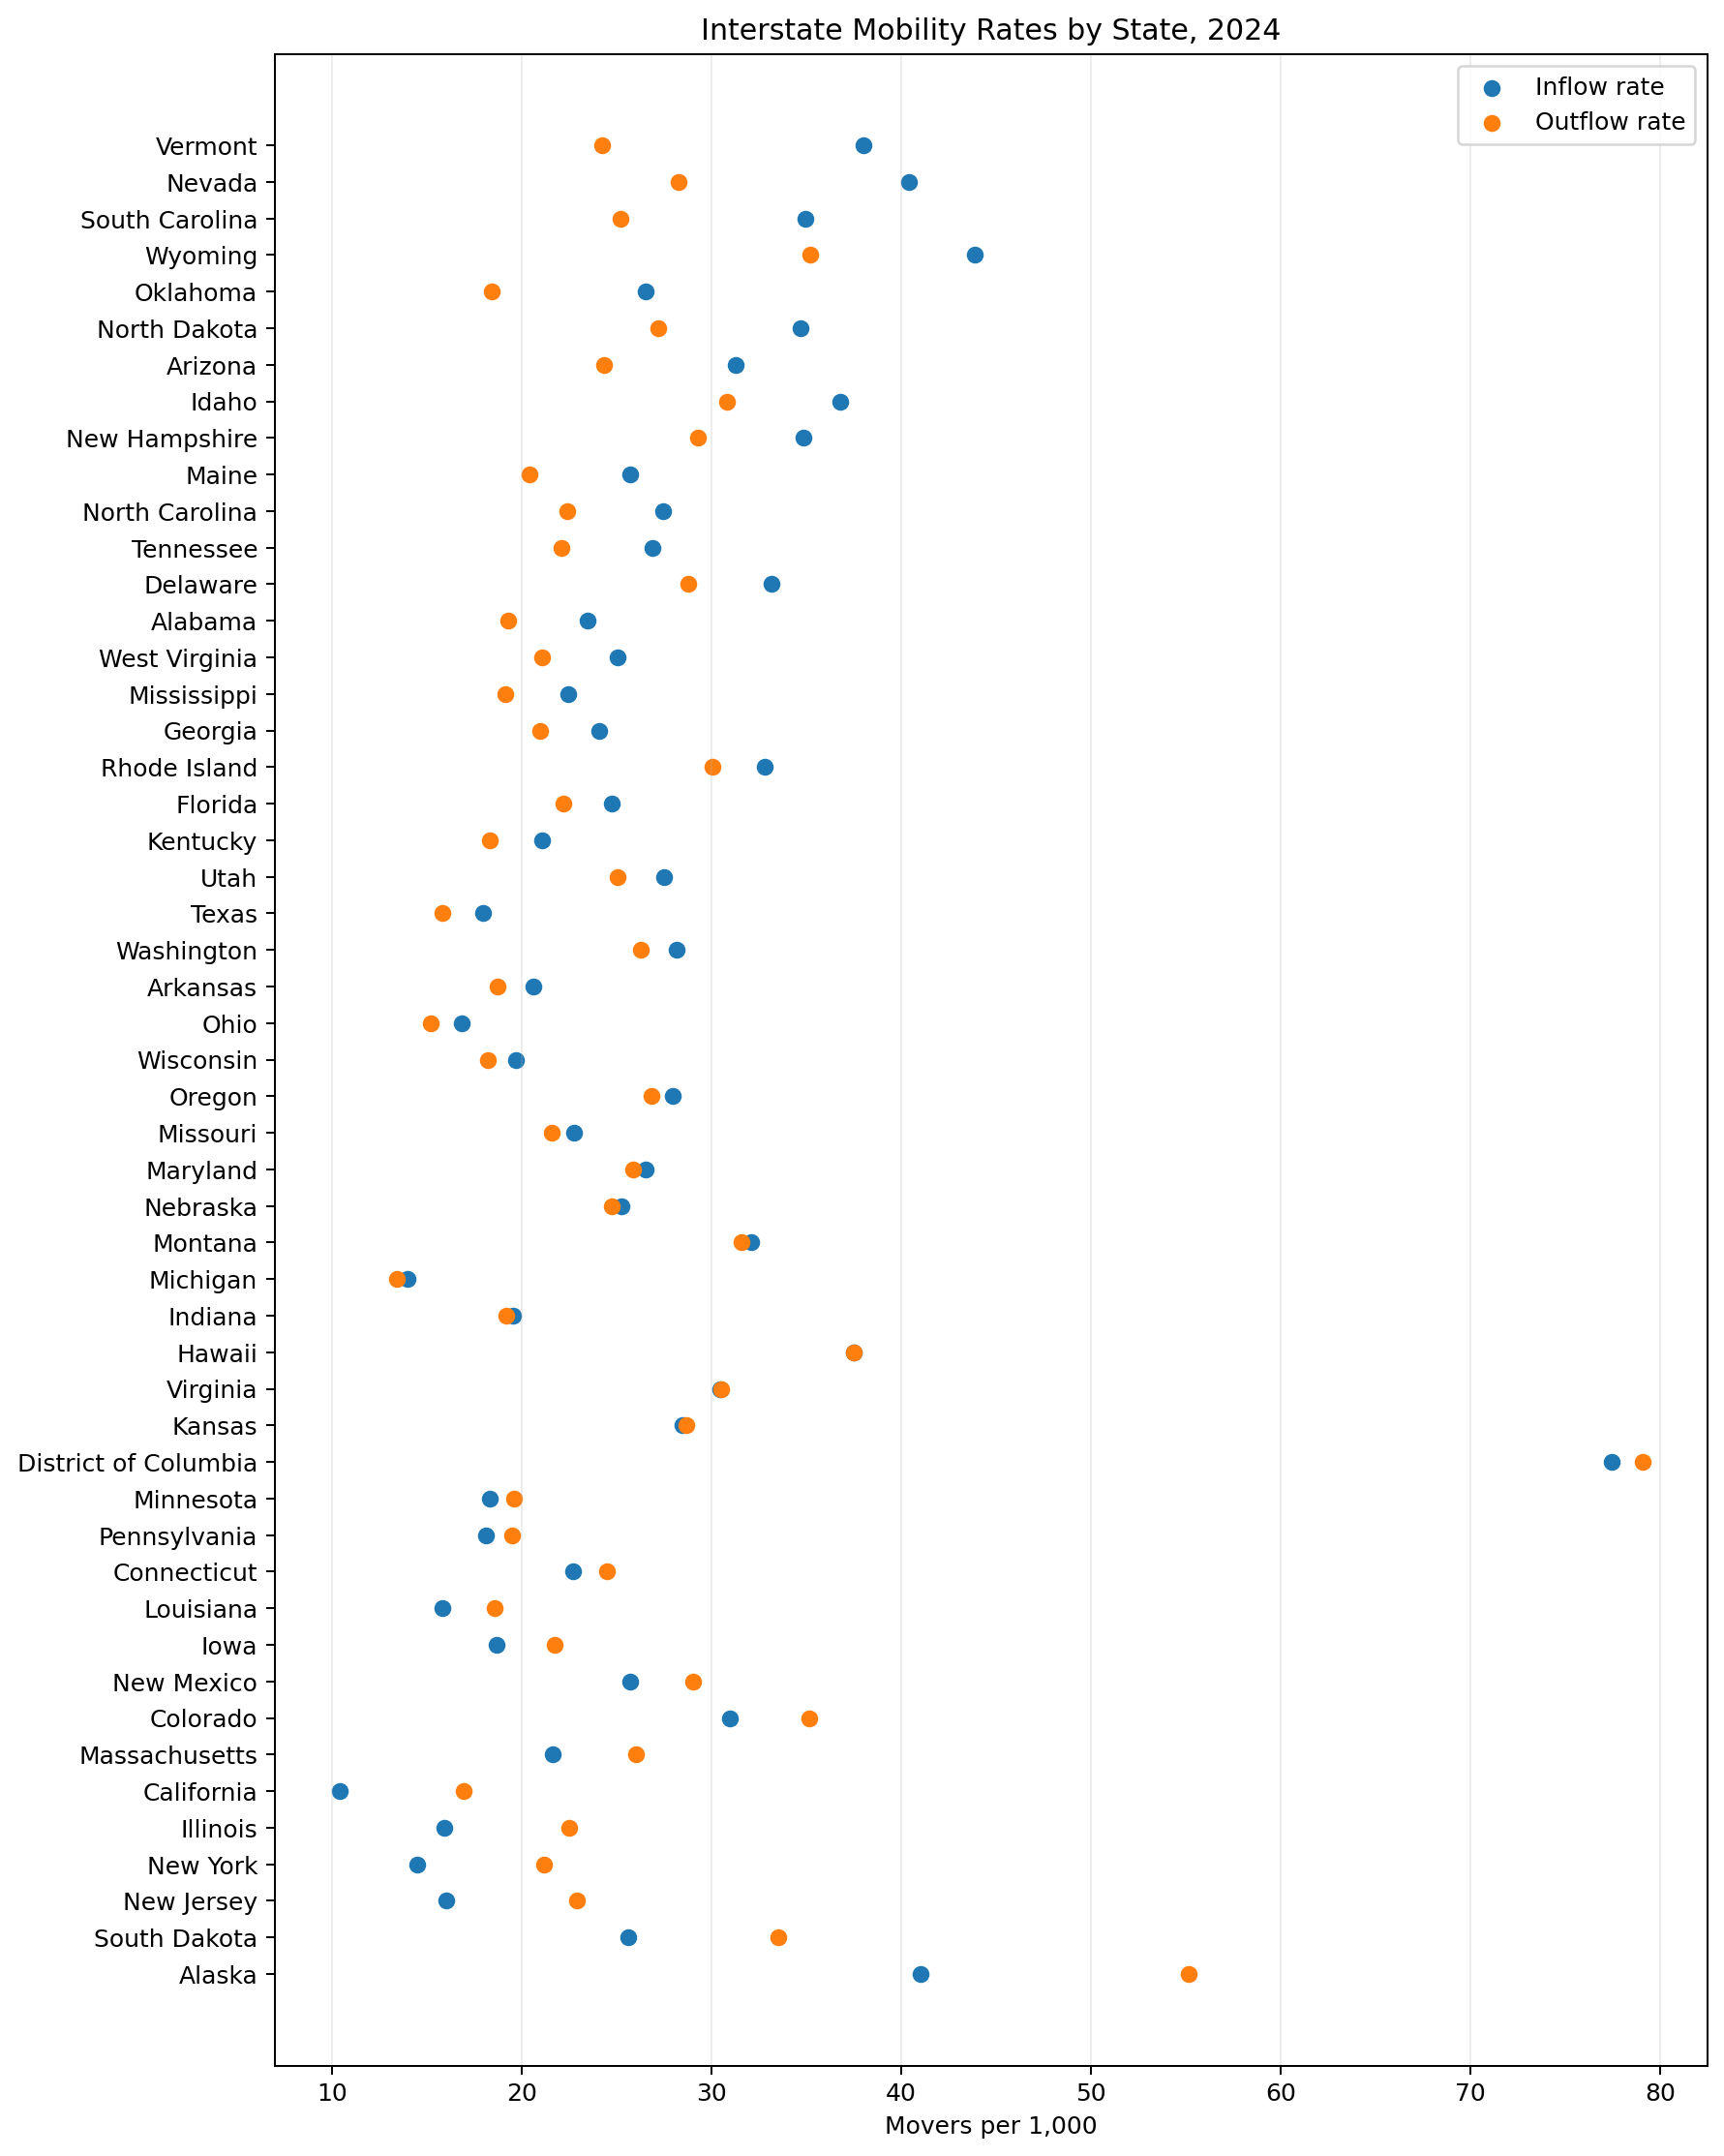
The map defaults to ACS interstate balance. Use the selector to switch to inflow rate, outflow rate, or balance rate. These are ACS flow measures, not the official Population Estimates net domestic migration series.
How Many Americans Move Between States?
The Census Bureau reports that 11.8 percent of people age 1 and over moved to a different residence in 2024. About 2.1 percent moved from a different state, down from 2.3 percent in 2023.
The 2024 supplemental table estimates 7,157,607 interstate movers into the 50 states and the District of Columbia from another state. Moves from abroad are measured separately.
Which States Gained the Most Interstate Movers?
Texas posted the largest positive ACS interstate balance at 72,680. Florida followed at 67,630. North Carolina gained 58,587, Arizona gained 55,160, and South Carolina gained 54,676.
South Carolina had a particularly high balance relative to its size, about 10.1 people per 1,000 current residents. Nevada and Oklahoma also had high positive balance rates.
Which States Lost the Most Interstate Movers?
California had the largest negative ACS interstate balance at 254,332. New York followed at 130,145, then Illinois at 82,470 and New Jersey at 63,913.
A negative interstate balance does not mean total population must fall. International migration, births, deaths, and other demographic changes also affect population totals.
Largest State to State Migration Flows
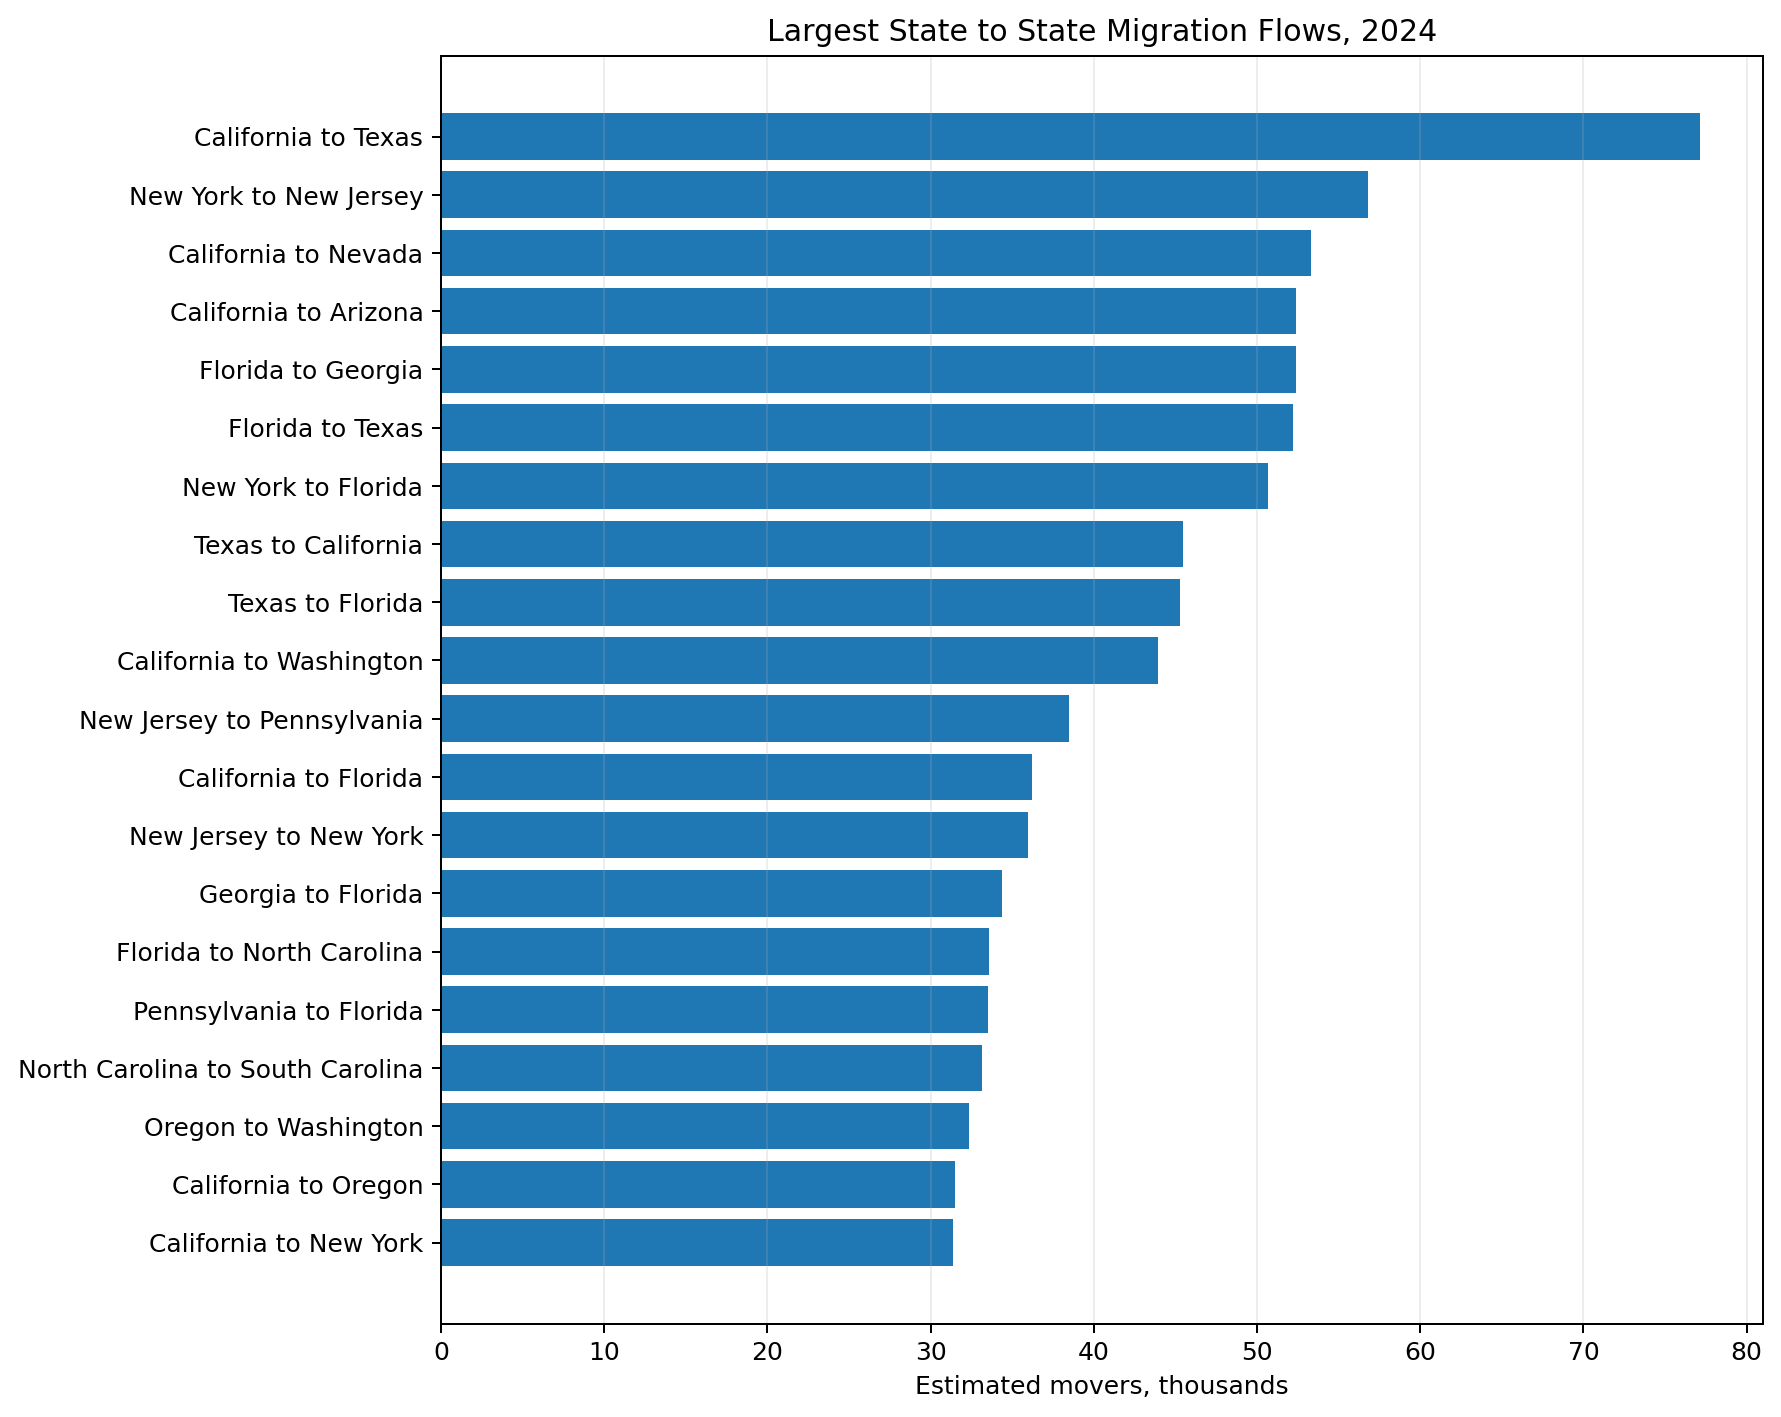
California to Texas was the largest directional route in 2024, with an estimated 77,161 movers and a 90 percent margin of error of 9,059. New York to New Jersey ranked second at 56,799.
| Rank | Origin | Destination | Movers | MOE | Share of origin outflow | Share of destination inflow |
|---|---|---|---|---|---|---|
| 1 | California | Texas | 77,161 | ±9,059 | 11.7% | 13.9% |
| 2 | New York | New Jersey | 56,799 | ±8,244 | 13.7% | 37.9% |
| 3 | California | Nevada | 53,289 | ±6,970 | 8.1% | 40.9% |
| 4 | California | Arizona | 52,383 | ±6,890 | 7.9% | 22.3% |
| 5 | Florida | Georgia | 52,371 | ±8,290 | 10.3% | 19.7% |
| 6 | Florida | Texas | 52,219 | ±8,571 | 10.3% | 9.4% |
| 7 | New York | Florida | 50,661 | ±6,714 | 12.2% | 8.8% |
| 8 | Texas | California | 45,447 | ±6,640 | 9.4% | 11.2% |
| 9 | Texas | Florida | 45,259 | ±12,219 | 9.4% | 7.9% |
| 10 | California | Washington | 43,938 | ±5,464 | 6.6% | 19.8% |
| 11 | New Jersey | Pennsylvania | 38,467 | ±4,874 | 17.9% | 16.4% |
| 12 | California | Florida | 36,194 | ±5,759 | 5.5% | 6.3% |
| 13 | New Jersey | New York | 36,002 | ±5,753 | 16.8% | 12.6% |
| 14 | Georgia | Florida | 34,388 | ±6,124 | 15.0% | 6.0% |
| 15 | Florida | North Carolina | 33,591 | ±4,724 | 6.6% | 11.2% |
| 16 | Pennsylvania | Florida | 33,530 | ±6,458 | 13.3% | 5.8% |
| 17 | North Carolina | South Carolina | 33,151 | ±5,633 | 13.7% | 17.5% |
| 18 | Oregon | Washington | 32,341 | ±4,186 | 28.7% | 14.6% |
| 19 | California | Oregon | 31,500 | ±4,443 | 4.8% | 26.7% |
| 20 | California | New York | 31,367 | ±4,875 | 4.7% | 11.0% |
Where People Move From and To: State Migration Flow Explorer
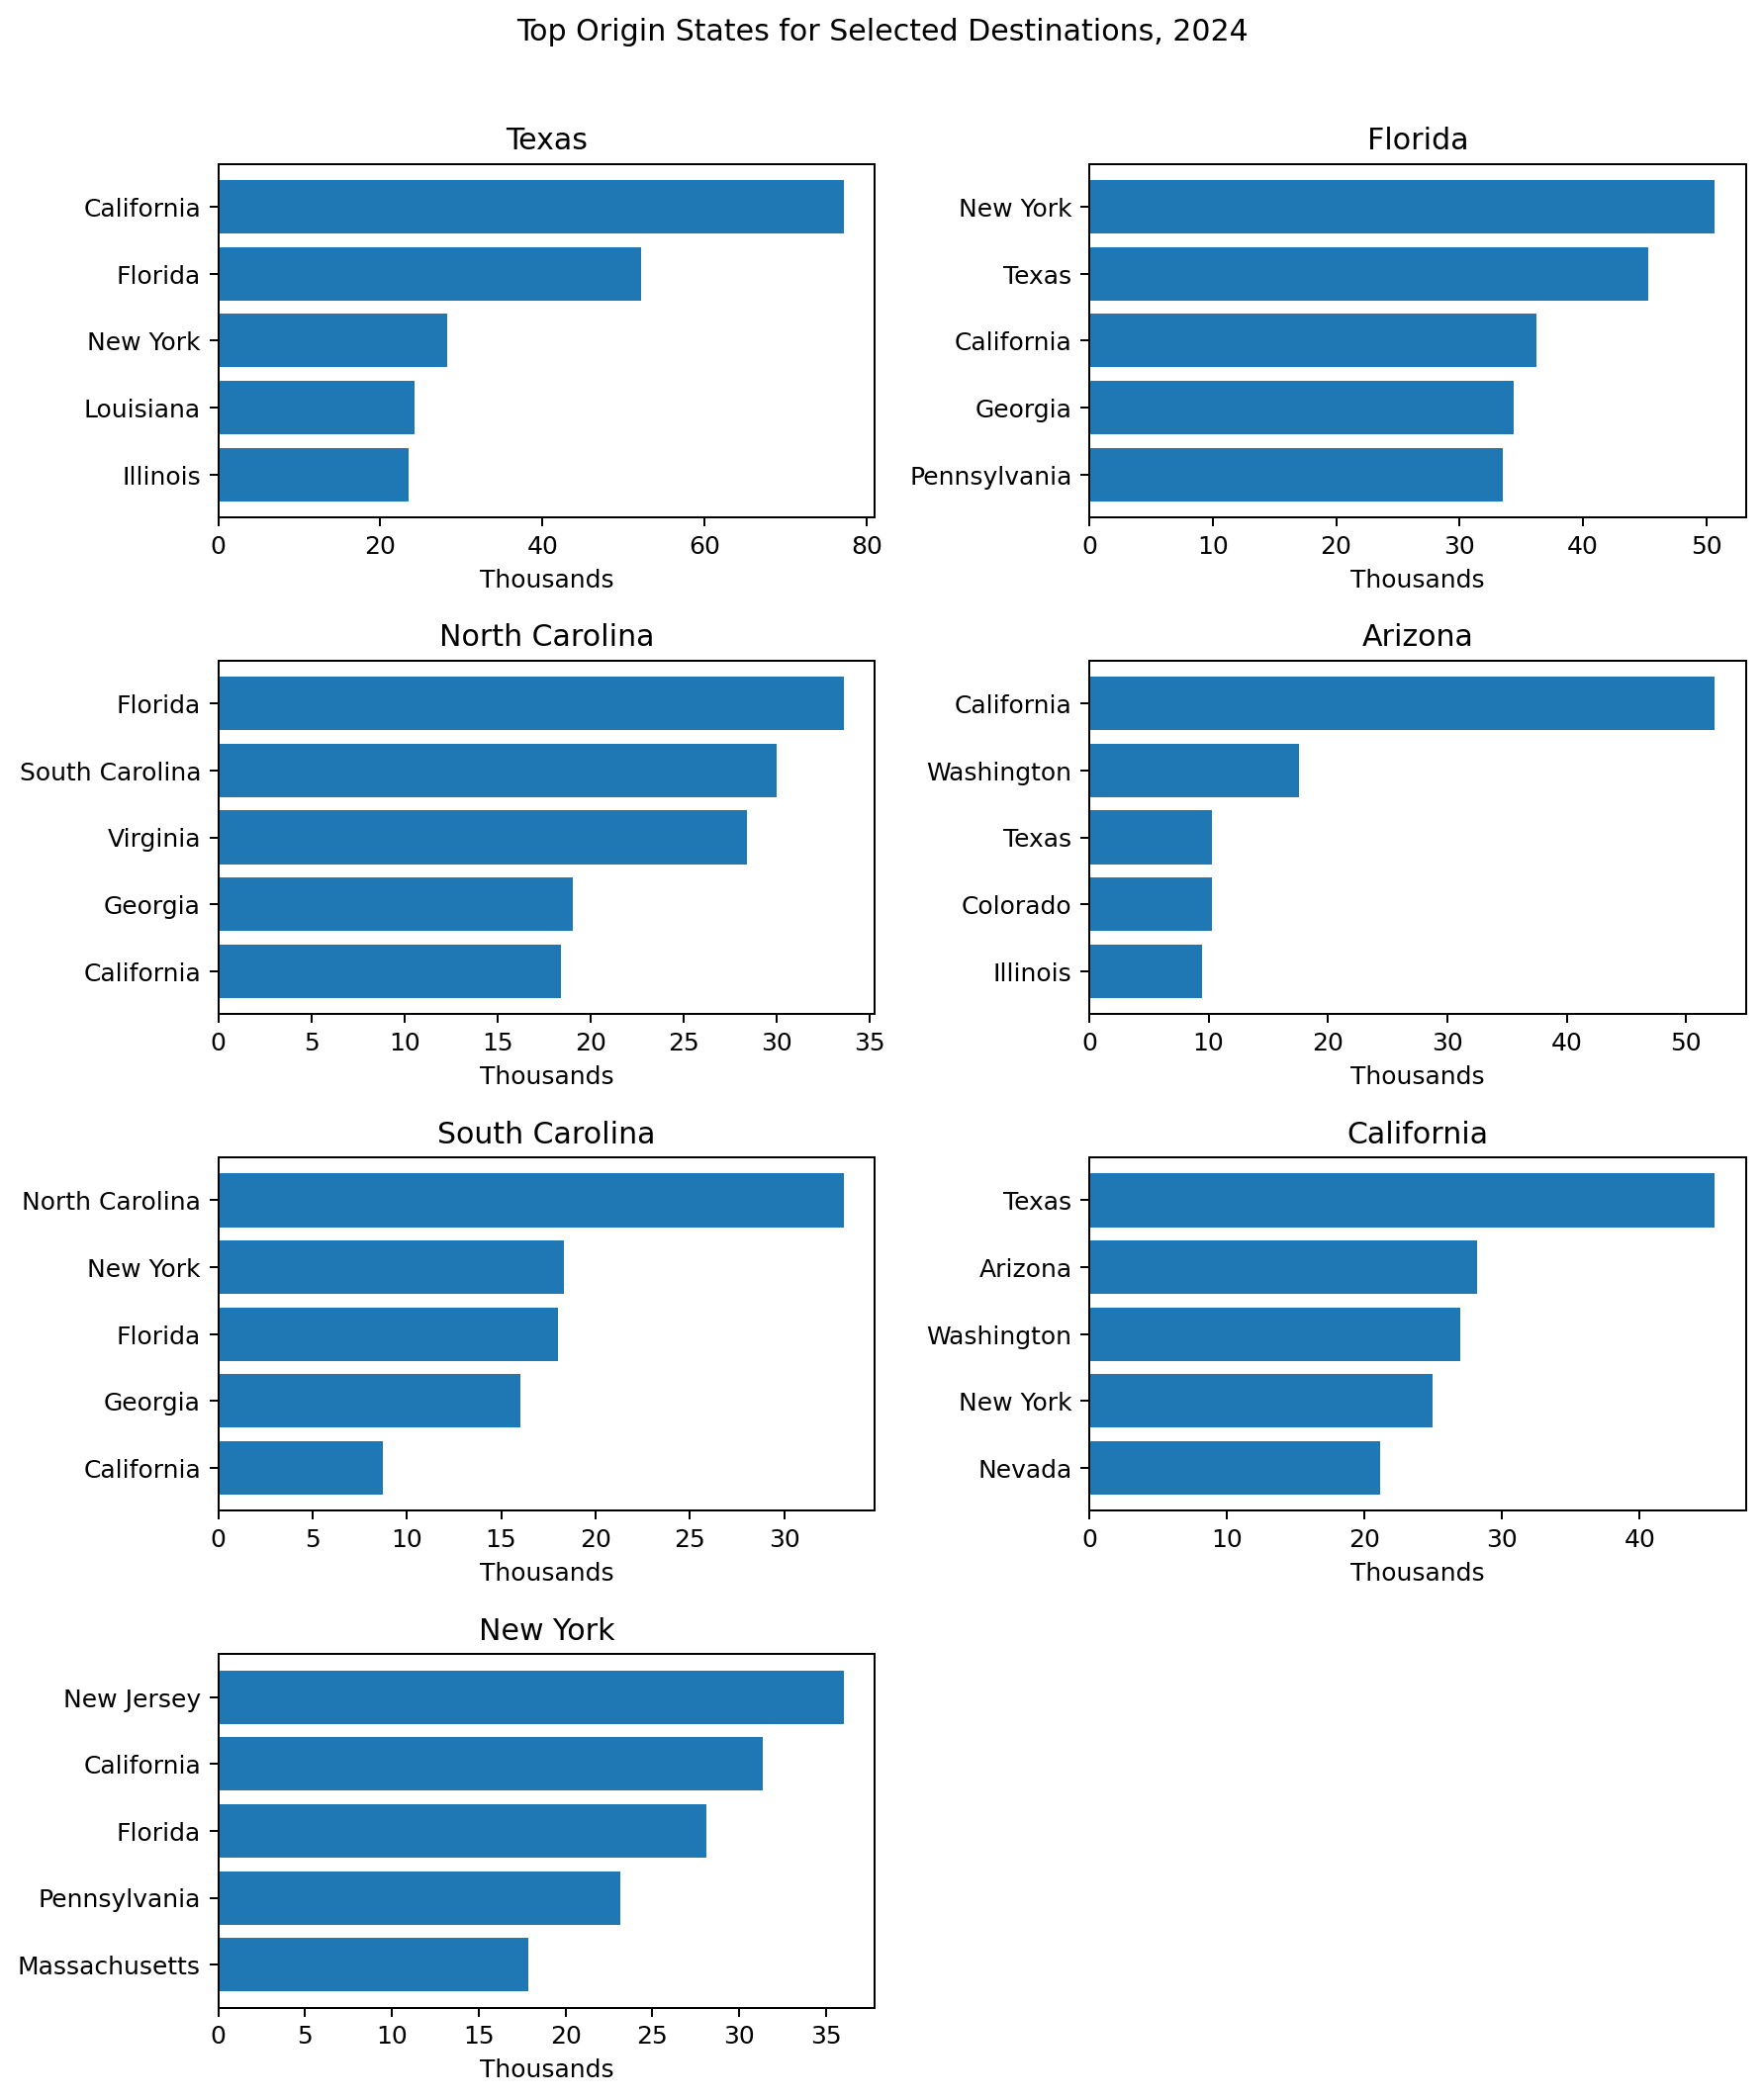
Select a state and a direction. The map shades the matching origin or destination states, and the table shows the five largest flows with margins of error.
How Interstate Migration Changed Over Time
The animation covers standard ACS one year state flow files from 2005 through 2024. The 2020 standard observation is omitted. The 2022 frame includes a Census caution because of the Connecticut processing error.
The full history uses interstate balance counts so the same measure can be carried through the older workbook formats. Standardized balance rates are available in the article data files from 2010 onward.
Why Migration Patterns Matter for Housing and Business
Interstate inflows can add housing demand when new residents arrive faster than homes are added. The effect depends on local supply, incomes, financing conditions, and where people settle inside a state.
Employers can gain or lose potential workers as people move. Migration can also change demand for retail, health care, transportation, schools, and other local services.
Business planners can use migration as one signal of changing market size. It should be combined with jobs, income, age, housing, and industry data rather than treated as a single cause of regional growth.
What the Census Data Actually Measure
The ACS asks people age 1 and over where they lived one year ago. State to state flows compare current residence with state of residence one year earlier.
Interstate Inflow, Outflow, and ACS Interstate Balance
Inflow counts people now in a state who lived in another state one year earlier. Outflow counts people who left an origin state for another state. This article defines ACS interstate balance as inflow minus outflow.
Why ACS Interstate Balance Is Not the Same as Population Estimate Net Domestic Migration
The Population Estimates Program uses a different method to estimate official net domestic migration. The ACS balance in this article is a calculation from one year flow tables. The two measures should not be used as if they were the same product.
How to Read Margins of Error
The ACS is a sample survey. The 2024 workbook reports 90 percent margins of error. When two values are close, a small rank difference may not be meaningful.
How to Download Census Migration Data With Python
import pandas as pd

url = (
    'https://www2.census.gov/programs-surveys/'
    'demo/tables/geographic-mobility/2024/'
    'state-to-state-migration/'
    'State_to_State_Migration_Table_2024_T13.xlsx'
)

flows = pd.read_excel(
    url,
    sheet_name='Table',
    skiprows=8,
    names=['current_state', 'previous_state', 'estimate', 'moe']
)
Keep special Census values such as N and X as missing or not applicable. Do not turn them into zero.
state_summary['acs_balance'] = (
    state_summary['inflow']
    - state_summary['outflow']
)

state_summary['balance_rate_per_1000'] = (
    state_summary['acs_balance']
    / state_summary['population_1_plus']
    * 1000
)
How to Build the Interactive Maps in Python
import plotly.express as px

fig = px.choropleth(
    state_summary,
    locations='state_code',
    locationmode='USA-states',
    color='acs_balance',
    scope='usa',
    hover_name='state',
    hover_data=['inflow', 'outflow', 'balance_rate_per_1000']
)
fig.show()
Data Quality Notes for 2020 and 2022
The standard 2020 ACS one year estimates are not used because the pandemic disrupted data collection and Census released experimental estimates instead of the usual product.
Census identified a processing error in the 2022 state to state flows involving Connecticut. Connecticut should not be compared normally with other years, and Census advises caution for other state comparisons involving the 2022 file. The issue was corrected for 2023.
Limits of State Migration Data
- The one year lookback does not capture every move a person made during the year.
- The flow table does not explain why people moved.
- State totals can hide metro and county differences.
- Moves from abroad are separate from interstate moves.
- Smaller route estimates can have large margins of error.
Conclusion
The latest migration between US states data show strong positive ACS interstate balances in Texas, Florida, North Carolina, Arizona, and South Carolina. California, New York, Illinois, and New Jersey had the largest negative balances. California to Texas was the largest directional route.
The useful story is not simply which state won or lost. Every state has people arriving and leaving. Direction, scale, rate, uncertainty, and long run context all matter when using migration data to understand housing, labor, public services, and business demand.
Frequently Asked Questions
Which U.S. states gained the most interstate movers in 2024?
Texas had the largest positive ACS interstate balance at about 72,680. Florida followed at 67,630, then North Carolina, Arizona, and South Carolina.
Which states lost the most residents to other states?
California had the largest negative ACS interstate balance at about 254,332. New York, Illinois, and New Jersey also had large negative balances.
What was the largest state to state migration flow in 2024?
California to Texas was the largest directional flow, with an estimated 77,161 movers.
How many Americans moved to a different state in 2024?
The ACS reports that 2.1 percent of people age 1 and over moved from a different state. The supplemental flow total is about 7.16 million interstate movers into the 50 states and the District of Columbia.
What does ACS interstate balance mean?
In this article, ACS interstate balance equals interstate inflow minus interstate outflow. It is an author calculation from the ACS flow tables.
Is ACS interstate balance the same as net domestic migration?
No. Official Population Estimates net domestic migration is a different Census product with a different method.
Why do Census migration estimates have margins of error?
The ACS is a sample survey. Margins of error describe sampling uncertainty around each estimate at a 90 percent confidence level.
Why is 2020 missing from the long run series?
Census did not release the standard 2020 ACS one year estimates because the pandemic disrupted data collection. Experimental estimates should not be mixed into the standard series as if they were fully comparable.
What happened to Connecticut migration data in 2022?
Census identified a processing error affecting Connecticut flows in the 2022 one year estimates. The agency advises against normal Connecticut comparisons and urges caution for other states that year.
How often are state to state migration flows released?
The ACS state to state migration flow package is annual. The 2024 package was released January 21, 2026.
Can I download Census state migration data with Python?
Yes. The official Excel workbooks can be downloaded and read with pandas or openpyxl, then reshaped for maps and flow analysis.
.
2024 State Interstate Migration Summary
Margins of error shown here are the separate Census inflow and outflow margins. The ACS balance is an author calculation.
| State | Inflow | Inflow MOE | Outflow | Outflow MOE | ACS balance | Balance per 1,000 |
|---|---|---|---|---|---|---|
| Texas | 556,156 | ±23,072 | 483,476 | ±23,279 | +72,680 | +2.3 |
| Florida | 573,876 | ±26,084 | 506,246 | ±23,230 | +67,630 | +2.9 |
| North Carolina | 299,782 | ±14,105 | 241,195 | ±15,896 | +58,587 | +5.4 |
| Arizona | 234,926 | ±15,380 | 179,766 | ±9,799 | +55,160 | +7.3 |
| South Carolina | 189,333 | ±11,927 | 134,657 | ±8,992 | +54,676 | +10.1 |
| Nevada | 130,813 | ±11,506 | 89,535 | ±7,951 | +41,278 | +12.8 |
| Georgia | 266,483 | ±15,404 | 229,471 | ±14,333 | +37,012 | +3.3 |
| Tennessee | 192,215 | ±11,673 | 156,435 | ±13,458 | +35,780 | +5.0 |
| Oklahoma | 107,523 | ±7,142 | 73,623 | ±7,485 | +33,900 | +8.4 |
| Alabama | 119,890 | ±9,899 | 97,658 | ±8,922 | +22,232 | +4.4 |
| Ohio | 197,890 | ±10,555 | 177,575 | ±11,526 | +20,315 | +1.7 |
| Washington | 222,059 | ±12,169 | 204,352 | ±10,306 | +17,707 | +2.2 |
| Kentucky | 95,793 | ±8,277 | 82,563 | ±6,320 | +13,230 | +2.9 |
| Idaho | 72,817 | ±6,331 | 60,351 | ±6,848 | +12,466 | +6.3 |
| Mississippi | 65,391 | ±7,071 | 55,258 | ±8,138 | +10,133 | +3.5 |
| Wisconsin | 116,355 | ±7,856 | 107,081 | ±8,746 | +9,274 | +1.6 |
| Utah | 95,218 | ±8,920 | 85,952 | ±8,041 | +9,266 | +2.7 |
| Vermont | 24,503 | ±4,002 | 15,366 | ±2,296 | +9,137 | +14.2 |
| New Hampshire | 48,666 | ±5,238 | 40,570 | ±5,452 | +8,096 | +5.8 |
| Missouri | 140,693 | ±8,081 | 132,632 | ±11,082 | +8,061 | +1.3 |
| Maine | 35,900 | ±4,509 | 28,146 | ±4,603 | +7,754 | +5.6 |
| West Virginia | 43,945 | ±4,712 | 36,791 | ±4,611 | +7,154 | +4.1 |
| North Dakota | 27,348 | ±3,869 | 21,106 | ±2,877 | +6,242 | +7.9 |
| Michigan | 140,413 | ±11,989 | 134,292 | ±8,374 | +6,121 | +0.6 |
| Arkansas | 62,908 | ±6,197 | 56,812 | ±7,027 | +6,096 | +2.0 |
| Oregon | 118,547 | ±8,898 | 112,955 | ±8,852 | +5,592 | +1.3 |
| Wyoming | 25,548 | ±4,267 | 20,247 | ±3,269 | +5,301 | +9.1 |
| Maryland | 164,424 | ±11,995 | 159,125 | ±9,310 | +5,299 | +0.9 |
| Delaware | 34,602 | ±5,439 | 29,719 | ±4,092 | +4,883 | +4.7 |
| Rhode Island | 36,203 | ±4,735 | 32,711 | ±4,923 | +3,492 | +3.2 |
| Indiana | 133,951 | ±8,842 | 130,728 | ±8,518 | +3,223 | +0.5 |
| Virginia | 265,514 | ±10,659 | 263,931 | ±16,614 | +1,583 | +0.2 |
| Nebraska | 49,949 | ±5,167 | 48,631 | ±5,794 | +1,318 | +0.7 |
| Montana | 36,159 | ±4,898 | 35,447 | ±4,254 | +712 | +0.6 |
| Hawaii | 53,744 | ±5,818 | 53,214 | ±7,863 | +530 | +0.4 |
| Kansas | 83,676 | ±6,803 | 83,761 | ±8,394 | -85 | -0.0 |
| District of Columbia | 53,791 | ±5,438 | 54,246 | ±5,656 | -455 | -0.7 |
| Connecticut | 82,686 | ±6,921 | 88,508 | ±7,220 | -5,822 | -1.6 |
| Minnesota | 104,959 | ±6,614 | 111,705 | ±8,438 | -6,746 | -1.2 |
| New Mexico | 54,241 | ±5,272 | 61,085 | ±6,727 | -6,844 | -3.2 |
| South Dakota | 23,419 | ±3,342 | 30,718 | ±4,635 | -7,299 | -8.0 |
| Iowa | 59,946 | ±5,187 | 69,629 | ±5,917 | -9,683 | -3.0 |
| Alaska | 29,995 | ±4,464 | 40,610 | ±5,781 | -10,615 | -14.5 |
| Louisiana | 72,028 | ±7,628 | 84,194 | ±7,899 | -12,166 | -2.7 |
| Pennsylvania | 234,593 | ±14,143 | 251,701 | ±12,352 | -17,108 | -1.3 |
| Colorado | 182,469 | ±11,808 | 206,674 | ±12,462 | -24,205 | -4.1 |
| Massachusetts | 152,915 | ±10,293 | 182,947 | ±10,624 | -30,032 | -4.2 |
| New Jersey | 150,849 | ±11,279 | 214,762 | ±11,235 | -63,913 | -6.8 |
| Illinois | 200,326 | ±11,810 | 282,796 | ±13,033 | -82,470 | -6.6 |
| New York | 285,304 | ±14,460 | 415,449 | ±18,304 | -130,145 | -6.6 |
| California | 406,873 | ±16,100 | 661,205 | ±21,844 | -254,332 | -6.5 |
Methodology and Official Sources
Main source: U.S. Census Bureau, 2024 American Community Survey one year State to State Migration Flows. The flow package was released January 21, 2026. Data were checked August 24, 2026.
Downloads
Files attached to this article for your reference.