
JOLTS Data Analysis: Job Openings, Hires and Quits
A practical guide to JOLTS job openings, hires, and quits using official BLS data, Python code, historical charts, industry comparisons, and monthly labor market context.
JOLTS Data Analysis: Openings, Hires, and Quits
A practical guide to JOLTS job openings, hires, and quits using official BLS data, Python code, historical charts, industry comparisons, and monthly labor market context.
The monthly jobs report tells us how many people are employed and unemployed. JOLTS answers a different question. It shows how much employers are trying to hire, how many workers actually enter jobs, and how many people leave jobs during the month.
The latest JOLTS data analysis points to a labor market that is still creating plenty of openings, but where the pace of actual hiring is more restrained. In June 2026, job openings were 7.359 million, hires were 5.348 million, and quits were 3.232 million. BLS described openings as little changed, while hires and quits were unchanged.
That combination matters. The openings rate of 4.4 percent is still high compared with much of the history since 2001, while the hires rate of 3.4 percent is below its long run median. Employers are still reporting demand for workers, but they are not converting that demand into hires at an equally strong rate.
Quick Answer
What Is JOLTS and Why Does It Matter?
JOLTS stands for the Job Openings and Labor Turnover Survey. BLS uses the program to measure labor demand and movement into and out of jobs. The national series include openings, hires, quits, layoffs and discharges, other separations, and total separations.
JOLTS fills a gap left by the monthly Employment Situation report. Payroll employment tells us how many jobs exist. JOLTS shows some of the movement underneath that total, including vacancies, hiring, voluntary exits, and employer initiated separations.
For labor market analysis, this extra detail helps answer questions that one payroll number cannot. Are employers still looking for workers? Are they hiring quickly? Are workers willing to leave jobs? Are layoffs becoming more common?
The Most Important JOLTS Rule: Openings Are a Stock, Hires and Quits Are Flows
Before comparing the three headline measures, the timing difference has to be clear. Job openings count positions that are open on the last business day of the month. Hires count all additions to payroll during the entire month. Quits count voluntary separations during the entire month, with retirements and transfers to other locations reported elsewhere.
This means 7.359 million openings and 5.348 million hires are not two versions of the same thing. One is a point in time stock. The other is a monthly flow. Subtracting hires from openings does not produce a clean estimate of unfilled jobs.
The rate formulas also differ. The openings rate divides openings by employment plus openings. Hires, quits, layoffs, and total separations rates divide each monthly flow by employment.
How to Read the Main JOLTS Measures
| Measure | Stock or flow | Reference period | Rate formula in plain English | What a higher reading may suggest | Main caution |
|---|---|---|---|---|---|
| Job openings | Stock | Last business day of the month | Openings divided by employment plus openings | More active labor demand | A point in time stock, not a monthly flow |
| Hires | Flow | Entire month | Hires divided by employment | More additions to payroll | Can include rehires and transfers from other locations |
| Quits | Flow | Entire month | Quits divided by employment | More voluntary worker movement | Not a perfect worker confidence measure |
| Layoffs and discharges | Flow | Entire month | Layoffs and discharges divided by employment | More employer initiated separations | Small industries can show volatile monthly rates |
| Total separations | Flow | Entire month | Total separations divided by employment | More overall turnover | Includes quits, layoffs and other separations |
Latest JOLTS Data Analysis: June 2026
BLS released the June 2026 national JOLTS report on August 4, 2026. The latest estimates are preliminary. The next national release, covering July 2026, is scheduled for September 1, 2026.
Job openings were 7.359 million with a 4.4 percent rate. Hires were 5.348 million with a 3.4 percent rate. Quits were 3.232 million with a 2.0 percent rate. Layoffs and discharges were 1.766 million with a 1.1 percent rate. Total separations were 5.351 million with a 3.4 percent rate.
The month to month numerical changes are useful for calculation, but BLS statistical language matters. The agency said openings were little changed and hires and quits were unchanged. A small movement in an estimate should not automatically be called a trend.
U.S. JOLTS Labor Market Snapshot
| Measure | Latest level | Latest rate | Previous level | Previous rate | Month change | Year ago level | Year ago rate | Interpretation |
|---|---|---|---|---|---|---|---|---|
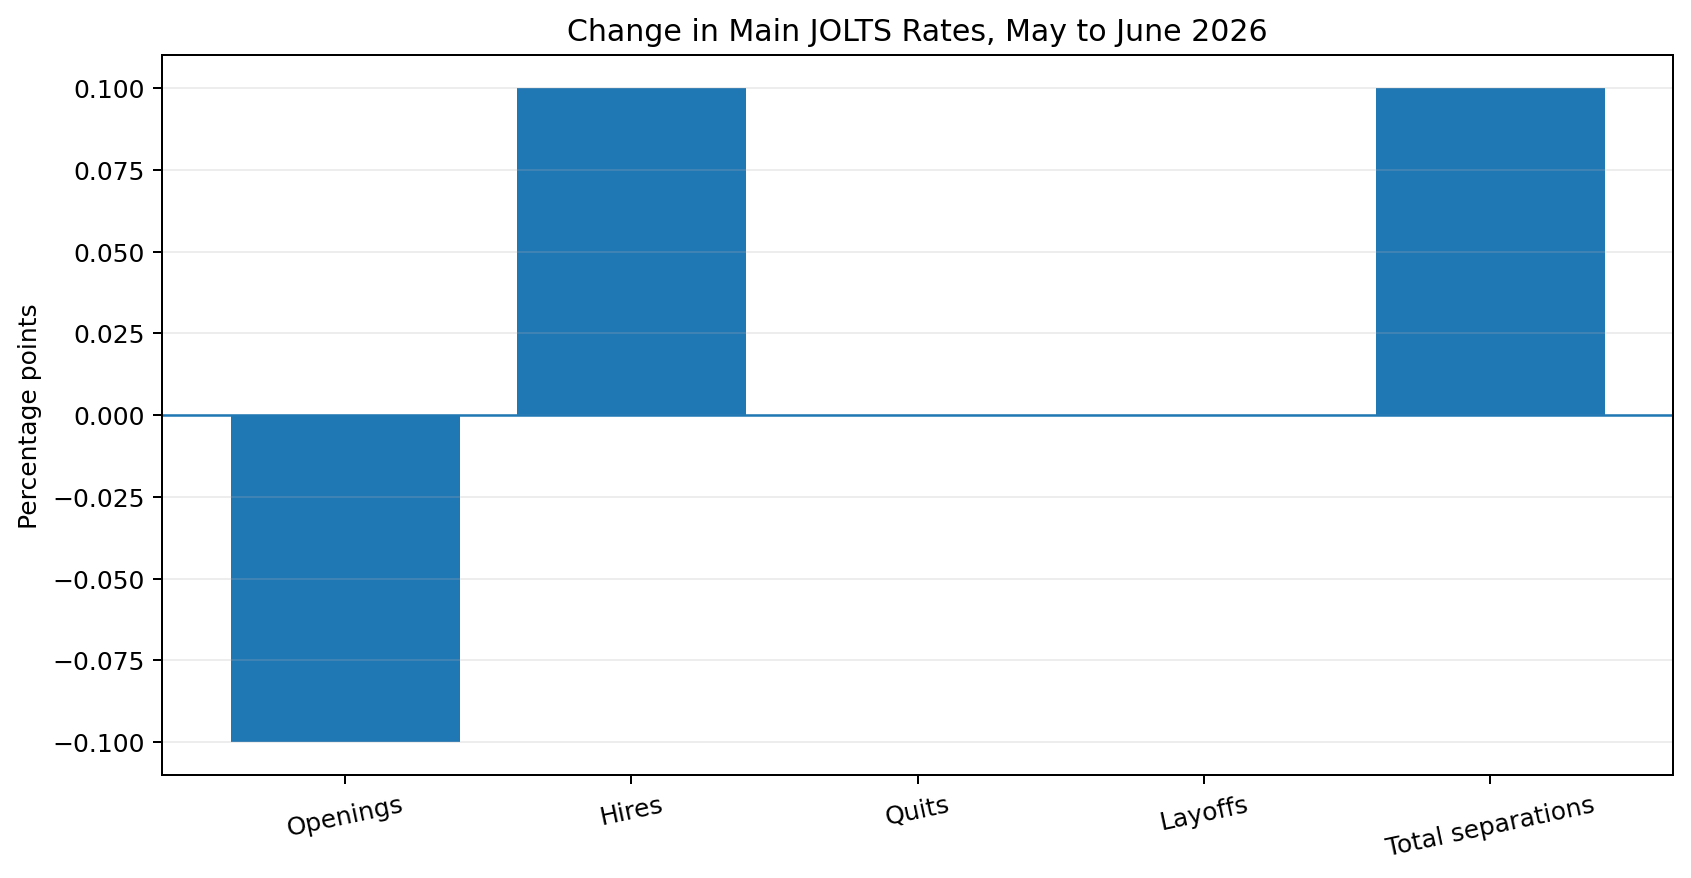
| Job openings | 7.359 million | 4.4% | 7.537 million | 4.5% | -178 thousand, -0.1 point | 7.204 million | 4.3% | Little changed. Demand remains above its long run rate median. |
| Hires | 5.348 million | 3.4% | 5.252 million | 3.3% | +96 thousand, +0.1 point | 5.327 million | 3.4% | Unchanged by BLS. Hiring flow remains softer than the openings rate. |
| Quits | 3.232 million | 2.0% | 3.153 million | 2.0% | +79 thousand, +0.0 point | 3.254 million | 2.1% | Unchanged by BLS. Voluntary movement is near its long run median rate. |
| Layoffs and discharges | 1.766 million | 1.1% | 1.761 million | 1.1% | +5 thousand, +0.0 point | 1.843 million | 1.2% | Unchanged by BLS. The rate remains low compared with history. |
| Total separations | 5.351 million | 3.4% | 5.260 million | 3.3% | +91 thousand, +0.1 point | 5.432 million | 3.4% | Little changed. Overall turnover is close to recent levels. |
What Job Openings Say About Labor Demand
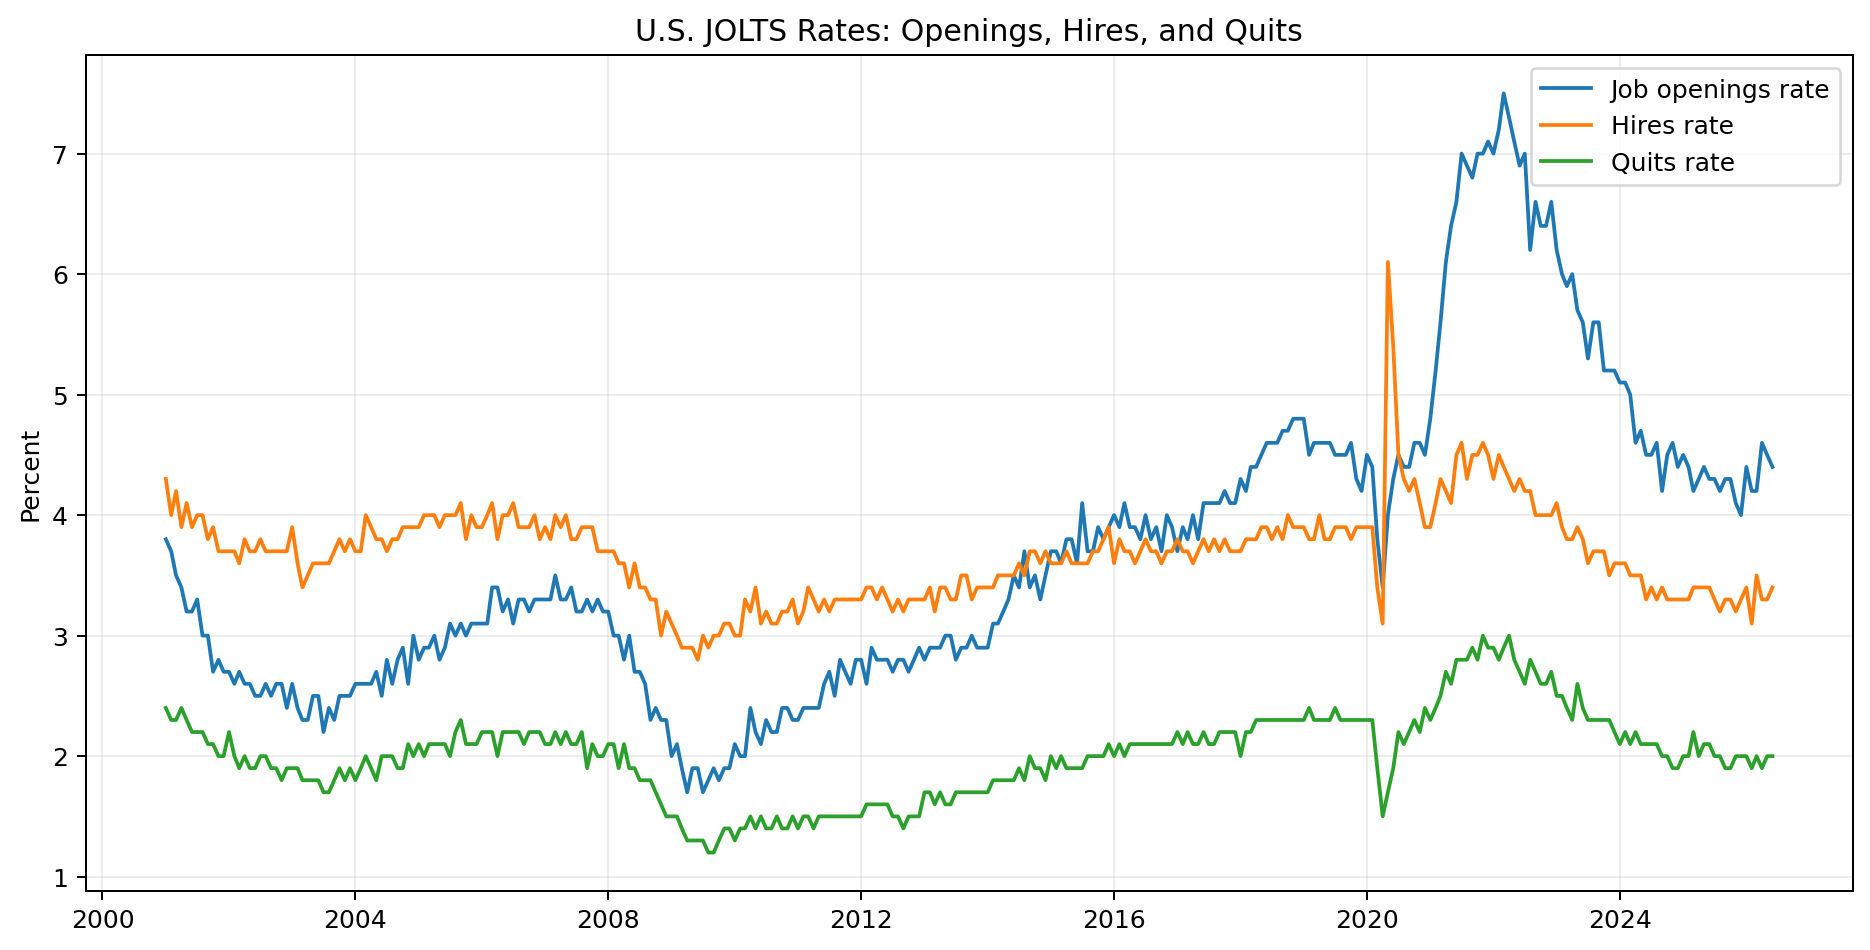
The June openings rate was 4.4 percent. Since January 2001, the median monthly openings rate is about 3.3 percent. The June reading is around the 76th percentile of the available monthly history.
The three month average openings rate through June was 4.5 percent. That is slightly above the June value itself, which suggests the latest month did not mark a sudden break from the recent range.
Openings are a useful measure of employer demand, but they are not the same as completed hiring. An employer can keep a position open for several months, change recruiting plans, or decide not to fill it. The opening count should be read with hires and other labor market indicators.
What Hires Say About Actual Labor Market Movement
The June hires rate was 3.4 percent. Its median since 2001 is about 3.7 percent, and the latest reading is only around the 31th percentile of the history.
That contrast with the openings rate is one of the clearest signals in the current data. Openings remain relatively high compared with history, while the hiring flow is much less unusual. This can happen when employers remain interested in workers but hire more selectively or take longer to fill positions.
The relationship should not be turned into a simple shortage measure. The two series use different reference periods, and hiring decisions depend on wages, skills, location, business demand, and many other factors.
What the Quits Rate Tells Us
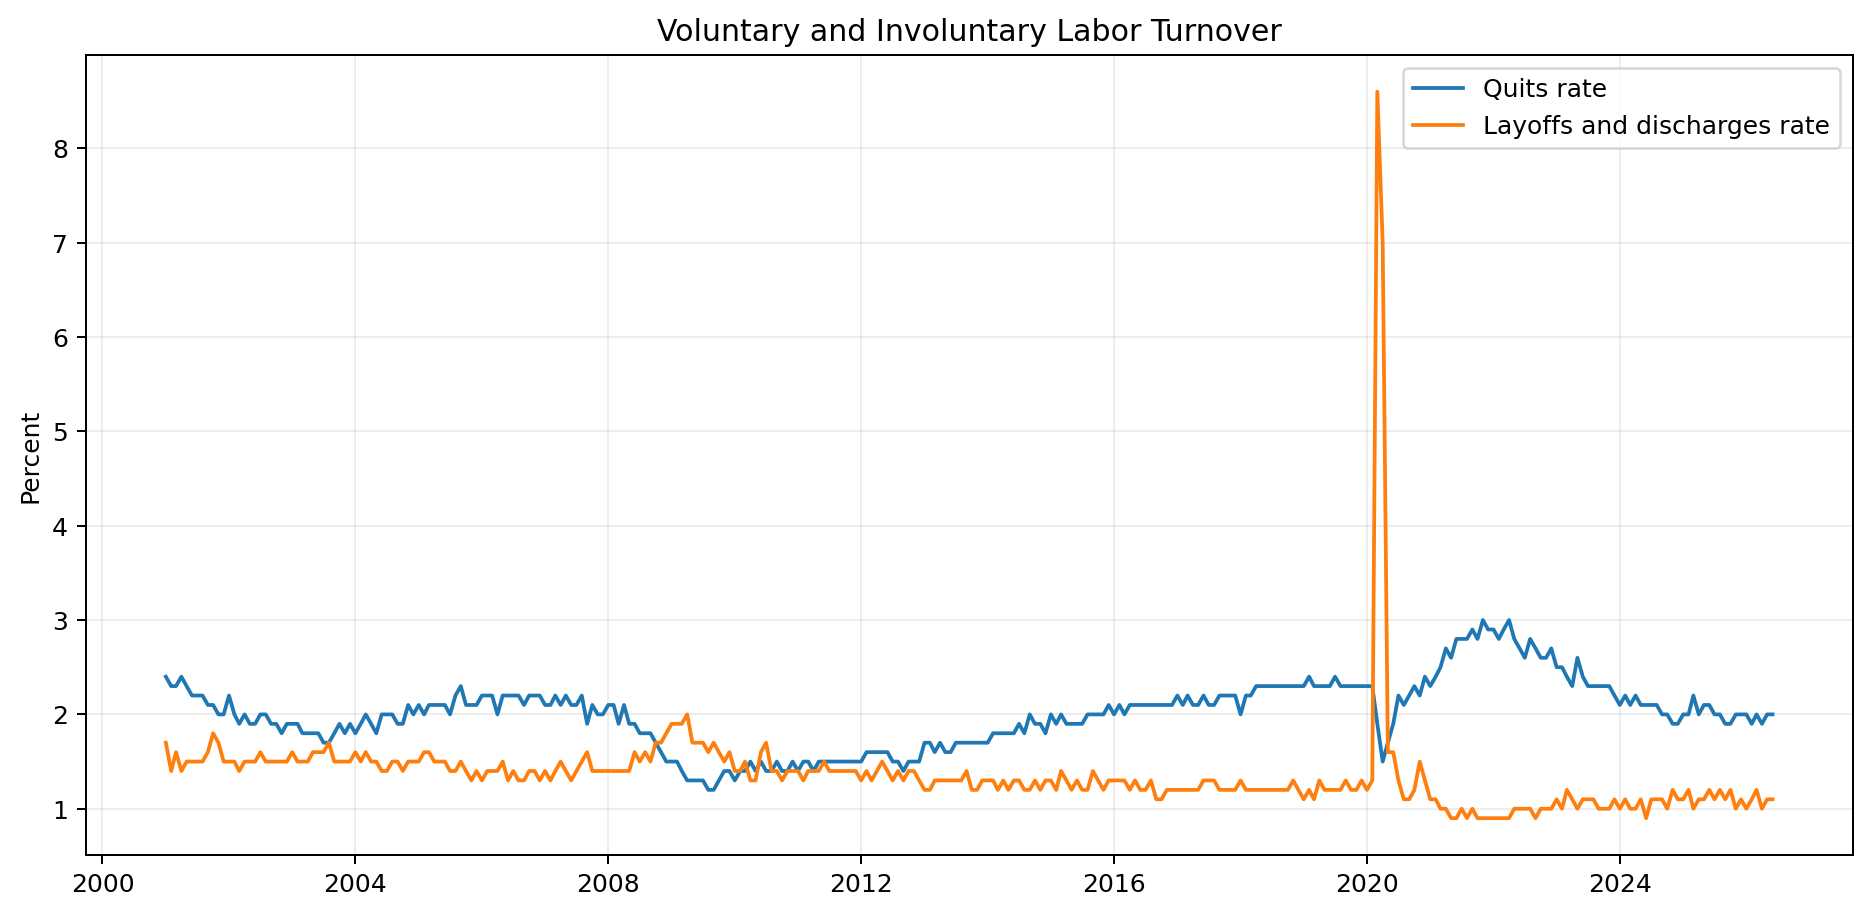
The quits rate was 2.0 percent in June. That is close to its long run median of 2.0 percent. Quits accounted for about 60.4 percent of total separations during the month.
BLS notes that quits can reflect workers willingness or ability to leave jobs. When workers see many attractive alternatives, voluntary exits can rise. When opportunities are harder to find, quits can fall.
The quits rate is not a perfect worker confidence index. Industry mix, wages, age, location, family needs, and business conditions can all affect a decision to leave a job.
Layoffs Remain Low by Historical Standards
The layoffs and discharges rate was 1.1 percent in June. The median since 2001 is about 1.3 percent, and the current reading is around the 21th percentile of the available history.
This is an important balance to the softer hiring picture. Hiring is not especially strong compared with history, but employer initiated separations also remain low. A slower hiring market is not automatically the same thing as a broad layoff wave.
Monthly layoff rates can be noisy, especially in smaller industries. A stronger conclusion should come from several months of data and supporting indicators, not one reading.
Labor Tightness: Unemployed Persons per Job Opening
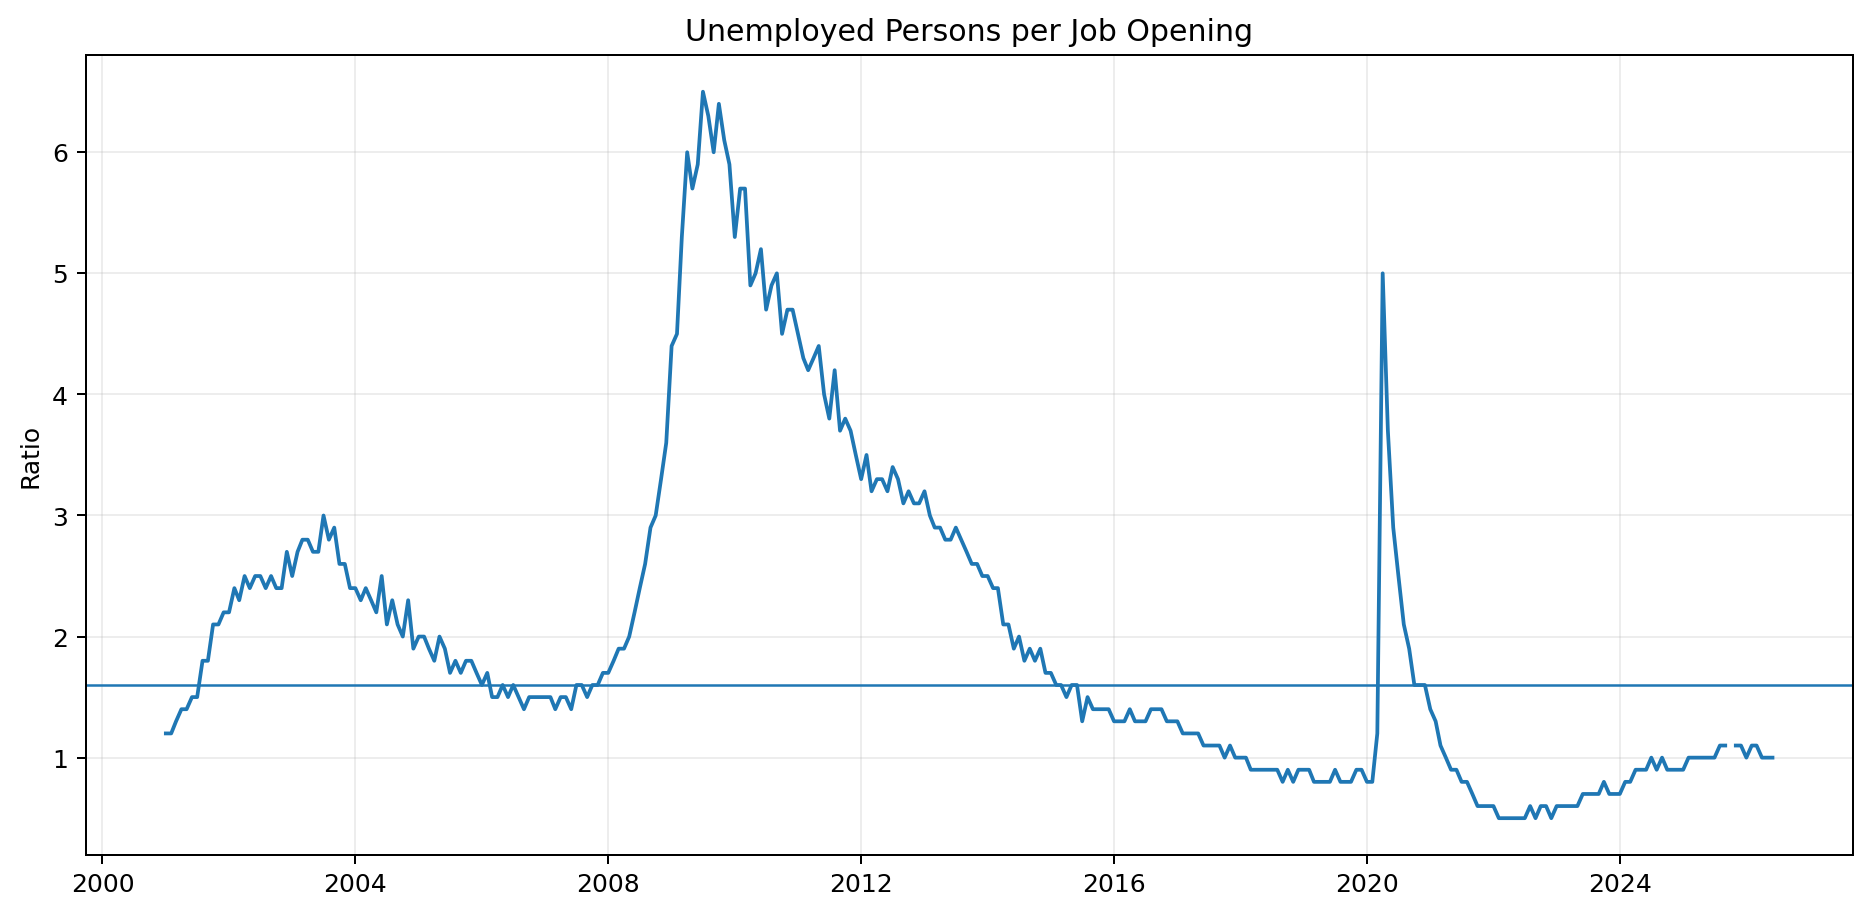
The BLS ratio of unemployed persons per job opening was 1.0 in June 2026. The median since 2001 is about 1.6. Lower values generally point to fewer unemployed people for each reported vacancy.
The current ratio is below its long run median, so labor demand is still relatively tight by this measure. At the same time, the ratio is not enough to prove that every employer faces a worker shortage. Skills and geography matter, and an opening in one industry may not match an unemployed worker in another.
This ratio is most useful when viewed through time. It can move quickly during recessions and recoveries, so the historical chart gives more context than the latest number alone.
Industry JOLTS Data: Where Turnover Is Highest
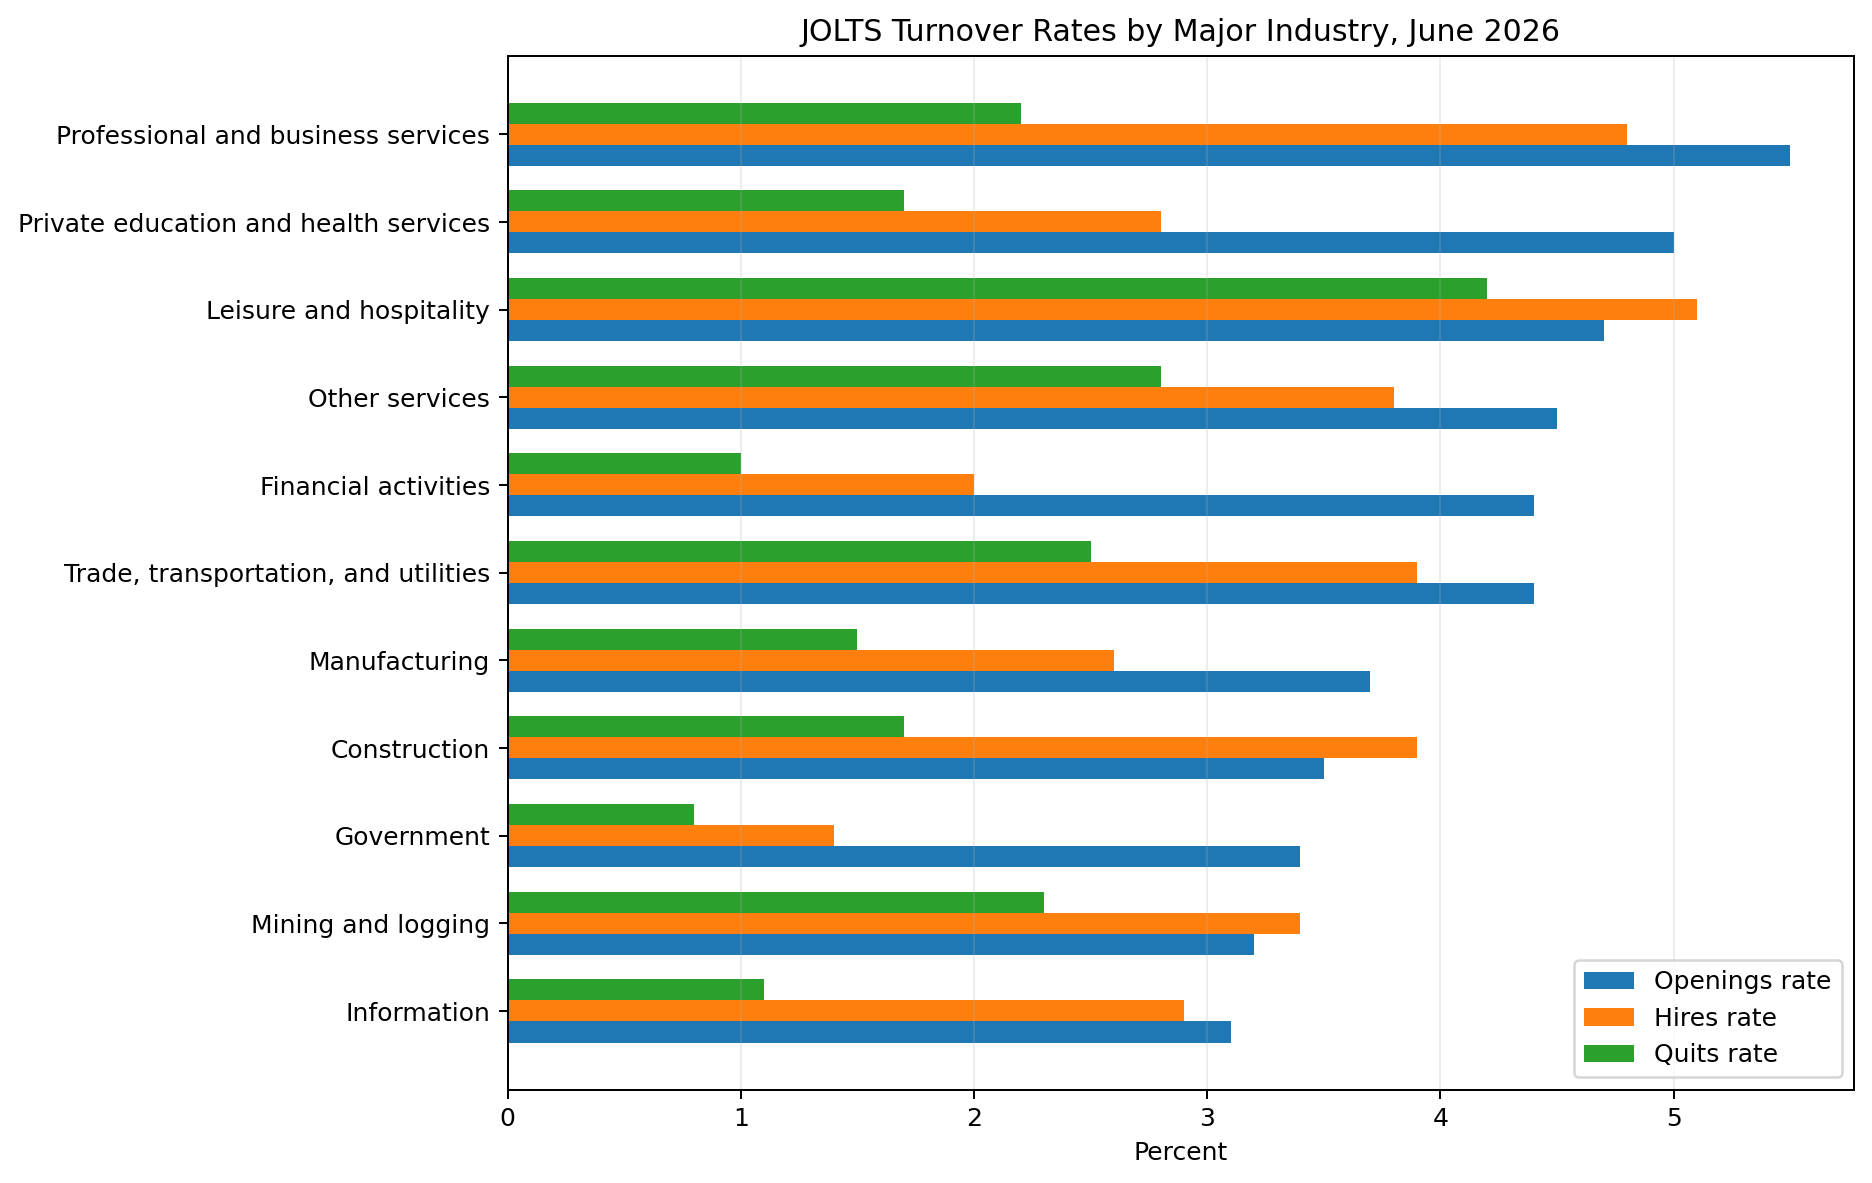
Industry rates are better than raw levels when comparing sectors of very different size. A large industry will usually have more openings and hires simply because it employs more people.
In June 2026, professional and business services had a 5.5 percent openings rate, the highest among the major industries shown here. Leisure and hospitality had the highest hires rate at 5.1 percent and the highest quits rate at 4.2 percent. Government had much lower hires and quits rates at 1.4 percent and 0.8 percent.
BLS also reported statistically notable level changes in some industries. Openings increased in transportation, warehousing, and utilities and in federal government. Openings decreased in wholesale trade, nondurable goods manufacturing, and mining and logging. Hires and quits each decreased in federal government.
JOLTS Industry Turnover Snapshot
| Industry | Openings rate | Hires rate | Quits rate | Layoffs rate | Openings rate change | Short note |
|---|---|---|---|---|---|---|
| Mining and logging | 3.2% | 3.4% | 2.3% | 1.6% | -1.4 point | Small sector. Rates can move sharply month to month. |
| Construction | 3.5% | 3.9% | 1.7% | 2.0% | +0.1 point | Hiring is active, while the openings rate is below the national rate. |
| Manufacturing | 3.7% | 2.6% | 1.5% | 0.7% | -0.2 point | Openings and hires are moderate, with quits below the national rate. |
| Trade, transportation, and utilities | 4.4% | 3.9% | 2.5% | 1.1% | +0.2 point | Openings and hiring are close to national rates. |
| Information | 3.1% | 2.9% | 1.1% | 2.0% | +0.6 point | Openings rose in rate terms, while layoffs remain elevated for this group. |
| Financial activities | 4.4% | 2.0% | 1.0% | 0.5% | +0.6 point | Openings rose, while hiring and quits remain low. |
| Professional and business services | 5.5% | 4.8% | 2.2% | 2.2% | -0.3 point | Highest openings rate among the major sectors shown. |
| Private education and health services | 5.0% | 2.8% | 1.7% | 0.7% | -0.4 point | Openings remain high, but quits and layoffs are lower. |
| Leisure and hospitality | 4.7% | 5.1% | 4.2% | 1.5% | -0.4 point | The highest hires and quits rates among the major sectors shown. |
| Other services | 4.5% | 3.8% | 2.8% | 0.9% | -0.1 point | Turnover remains relatively active. |
| Government | 3.4% | 1.4% | 0.8% | 0.4% | +0.0 point | Low hires and quits rates compared with private industries. |
Regional JOLTS Rates Add Another Layer
National averages can hide regional differences. In June 2026, the West had a 4.7 percent openings rate, while the Northeast had a 4.0 percent rate. The Midwest hires rate was 3.5 percent, slightly above the other regions.
The South had a 2.2 percent quits rate, the highest of the four broad regions in the latest data. These differences can reflect industry mix, population growth, wages, and local labor demand.
Regional JOLTS estimates are useful for context, but they are still broad. State data are available as a separate extension when a more local view is needed.
| Region | Openings rate | Hires rate | Quits rate |
|---|---|---|---|
| Northeast | 4.0% | 3.3% | 1.5% |
| Midwest | 4.2% | 3.5% | 2.0% |
| South | 4.5% | 3.4% | 2.2% |
| West | 4.7% | 3.3% | 2.1% |
Why JOLTS Revisions Matter
JOLTS estimates can change after the first release. For May 2026, BLS revised job openings down by 57,000 to 7.537 million. Hires were revised up by 82,000 to 5.252 million. Quits were revised up by 88,000 to 3.153 million, and layoffs and discharges were revised up by 53,000 to 1.761 million.
These revisions come from additional reports and recalculated seasonal factors. BLS also performs annual updates. The latest value should therefore be treated as an estimate, not a final count carved in stone.
A good monthly workflow always refreshes the previous month before calculating changes. Otherwise, a chart can compare a new preliminary number with an outdated prior estimate.
How JOLTS Differs From the Monthly Jobs Report
The Employment Situation report is built around payroll employment, unemployment, labor force participation, hours, and earnings. JOLTS focuses on vacancies and turnover.
The two reports answer related but different questions. Payroll employment is a net stock of jobs at a point in time. JOLTS hires and separations are gross flows that show movement into and out of payrolls during the month.
Do not assume that JOLTS hires minus separations will exactly equal payroll employment change. Survey concepts, reference periods, coverage, seasonal adjustment, and estimation methods differ.
How to Download JOLTS Data in Python
BLS offers a Public Data API and bulk time series files. The API is convenient for selected series and recent periods. The bulk files are useful when you want the full history or many industry series at once.
For a national tutorial, use seasonally adjusted total nonfarm series. The exact series IDs below cover levels and rates for openings, hires, quits, layoffs, total separations, and the unemployed persons per opening ratio.
The code should validate the latest month after every refresh. That simple check can catch stale downloads, missing observations, or a release timing mistake before the analysis is published.
Exact BLS National Series IDs and API Request
import requests
import pandas as pd

SERIES = {
    "openings_level": "JTS000000000000000JOL",
    "openings_rate": "JTS000000000000000JOR",
    "hires_level": "JTS000000000000000HIL",
    "hires_rate": "JTS000000000000000HIR",
    "quits_level": "JTS000000000000000QUL",
    "quits_rate": "JTS000000000000000QUR",
    "layoffs_level": "JTS000000000000000LDL",
    "layoffs_rate": "JTS000000000000000LDR",
    "separations_level": "JTS000000000000000TSL",
    "separations_rate": "JTS000000000000000TSR",
    "unemployed_per_opening": "JTS000000000000000UOR",
}

def fetch_bls(series_ids, start_year, end_year):
    url = "https://api.bls.gov/publicAPI/v2/timeseries/data/"
    payload = {
        "seriesid": list(series_ids),
        "startyear": str(start_year),
        "endyear": str(end_year),
    }
    response = requests.post(url, json=payload, timeout=30)
    response.raise_for_status()
    return response.json()
Parse the BLS Response Into a Monthly DataFrame
def parse_bls_response(payload, name_by_id):
    rows = []
    for series in payload["Results"]["series"]:
        name = name_by_id[series["seriesID"]]
        for item in series["data"]:
            period = item["period"]
            if not period.startswith("M") or period == "M13":
                continue
            rows.append({
                "series": name,
                "year": int(item["year"]),
                "month": int(period[1:]),
                "value": float(item["value"]),
            })
    data = pd.DataFrame(rows)
    data["date"] = pd.to_datetime(
        dict(year=data["year"], month=data["month"], day=1)
    )
    return data.pivot(index="date", columns="series", values="value").sort_index()

payload = fetch_bls(SERIES.values(), 2017, 2026)
wide = parse_bls_response(payload, {v: k for k, v in SERIES.items()})
print(wide.tail())
Calculate Moving Averages and Historical Percentiles
for col in [
    "openings_rate",
    "hires_rate",
    "quits_rate",
    "layoffs_rate",
]:
    wide[col + "_3ma"] = wide[col].rolling(3).mean()

latest = wide.iloc[-1]
previous = wide.iloc[-2]

def percentile_of_latest(series):
    clean = series.dropna()
    return 100 * (clean <= clean.iloc[-1]).mean()

print("Latest openings rate:", latest["openings_rate"])
print("Three month average:", latest["openings_rate_3ma"])
print("Historical percentile:", percentile_of_latest(wide["openings_rate"]))
Latest Month Rate Changes
The chart below shows the numerical change in each main rate from May to June 2026. BLS significance language still controls the interpretation of whether a movement is meaningful.
U.S. Labor Market Churn Through Time: Openings, Hires, and Quits
This interactive chart reveals the three main rates through time. Use Play or the year slider to see how openings, hires, and quits changed from 2001 through June 2026.
Interactive JOLTS rate history
Hover for monthly rates. The percentage scale stays fixed across frames.
How to Analyze JOLTS Data Without Overreading One Month
Monthly labor market data are noisy. A useful analysis should compare the latest rate with a three month average, a year earlier reading, and a long run historical range.
The current mix is a good example. The openings rate is relatively high compared with history, the hires rate is relatively low, quits are near their median, and layoffs are low. No single series tells the whole story.
The safest conclusion is that labor demand remains meaningful, but hiring activity is more restrained than the openings count alone would suggest. The low layoffs rate also argues against describing the current data as a broad labor market contraction.
Conclusion
The latest JOLTS data analysis shows a labor market with meaningful employer demand, slower hiring, normal voluntary turnover, and relatively low layoffs. The 4.4 percent openings rate remains high compared with much of the history since 2001, but the 3.4 percent hires rate is much less elevated.
That mix is more useful than any one headline number. Openings tell us about demand. Hires show completed additions to payroll. Quits show voluntary movement. Layoffs show employer initiated separations. Reading them together gives a clearer picture of labor market churn.
The article should be refreshed after every monthly JOLTS release. Update the prior month after revisions, recalculate the charts and percentiles, and preserve BLS statistical caution when the agency describes a movement as little changed or unchanged.
Frequently Asked Questions
What does JOLTS stand for?
JOLTS stands for the Job Openings and Labor Turnover Survey. BLS publishes monthly estimates of openings, hires, quits, layoffs, and other separations.
What is the latest JOLTS job openings number?
For June 2026, BLS reported 7.359 million job openings, with a 4.4 percent openings rate. The estimate is preliminary.
What does the quits rate mean?
The quits rate measures voluntary separations as a share of employment. It can reflect workers willingness or ability to leave jobs, but it is not a perfect measure of worker confidence.
Are job openings and hires directly comparable?
Not as matching monthly counts. Openings are measured on the last business day, while hires count additions to payroll during the full month.
What is a high JOLTS openings rate?
There is no single cutoff. Historical context is more useful. In June 2026 the 4.4 percent openings rate was around the 77th percentile of monthly readings since 2001.
Why can JOLTS data be revised?
BLS receives additional survey reports after the first estimate and recalculates seasonal factors. Annual updates can also revise history.
How often is JOLTS released?
National JOLTS data are released monthly. The next release after the June 2026 report is scheduled for September 1, 2026 and will cover July 2026.
Can I download JOLTS data with Python?
Yes. BLS provides a Public Data API and downloadable bulk time series files. The article includes exact national series IDs and reusable Python code.
What is unemployed persons per job opening?
It is a BLS ratio that compares the number of unemployed people with reported vacancies. Lower values generally indicate tighter labor demand relative to the number of unemployed workers.
Is JOLTS the same as the monthly jobs report?
No. The monthly jobs report focuses on employment, unemployment, hours, and earnings. JOLTS focuses on vacancies and worker turnover.
Suggested Internal Links
- Analyze the U.S. Unemployment Rate in Python
- FRED API in Python: Download and Analyze U.S. Economic Data
- GDP Forecasting in Python Using U.S. Economic Data
- CPI vs PCE Inflation: What Is the Difference?
- U.S. Labor Market Indicators With Python
Official Sources
Downloads
Files attached to this article for your reference.